I’m always scared of the bug that will finally break me - lose my sanity once and for all.
The main character, the leaky program, is a legacy rust application - a safe http interface for imagemagick. We are migrating it to Kubernetes. It handles image processing for our other services - enabling clients to upload images and get them processed and cached on the backend.
The migration went smoothly - we had a few hiccups, but nothing major. And then the hell broke loose. I received a message from our devops team that the application was scaling like crazy - we had a memory leak!
A memory leak in rust? That’s impossible! Rust is a safe language; it can’t have memory leaks! 1
But since we are using imagemagick, we are using FFI - and that’s where the problem must be.
To make things worse, the application was using jemalloc, but imagemagick started using system allocator a long time ago.
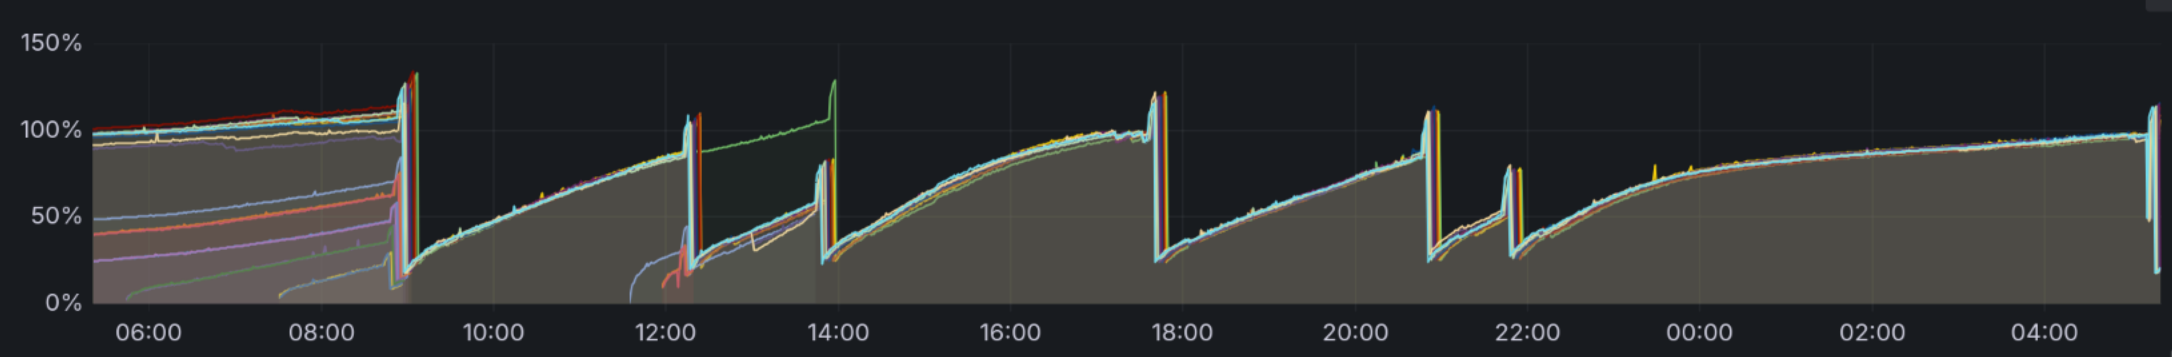
I started by checking grafana dashboards. Our ops team had set up a nice monitoring system that showed me the application’s memory usage. We also had an excellent alerting system that would notify me if the memory usage exceeded a certain threshold.
The dashboard was called Memory Usage (w/o cache). It is a nice graph showing me the application’s memory usage without the cache.
We clearlly had seen a memory growing over time - see featured image.
And so the hunt began. With it, there is growing frustration and uncertainty every step of the way.
The hunt begins - tracing using eBPF Link to heading
At this point, I was sure that the problem was in the FFI code. I wanted to pinpoint the exact location of the leak. And fix it as soon as possible.
My intuition told me that the leak was in the specific new alias (a bunch of image transformations) that we had added to the application simultaneously with the migration.
Since the application was under production load, I wanted to use the least intrusive method of tracing the memory usage.
I’ve tried to start with memleak from BCC tools, but I’ve had no luck from inside the container.
We could have asked the devops team to install the BCC tools on the host, and get the ssh access to the host, but that would be a last resort.
The hunt continues - using heaptrack
Link to heading
In my previous blog post I wrote about heaptrack - a tool that can trace heap allocations by tracing malloc and free calls.
I’ve used it before and it has been an excellent tool for finding memory leaks in c/rust/C++ applications.
We had to add the heaptrack and gdb to the container, deploy the application, exec to inside the container, and gather the data using heaptrack -p 1.
I then discovered that we were missing tar in the container, so we couldn’t use kubectl cp to copy the data from the container to the host.
After some time, we had the data on the host and I could analyze it using heaptrack_gui.
The graph showed me that the memory was not growing over time!
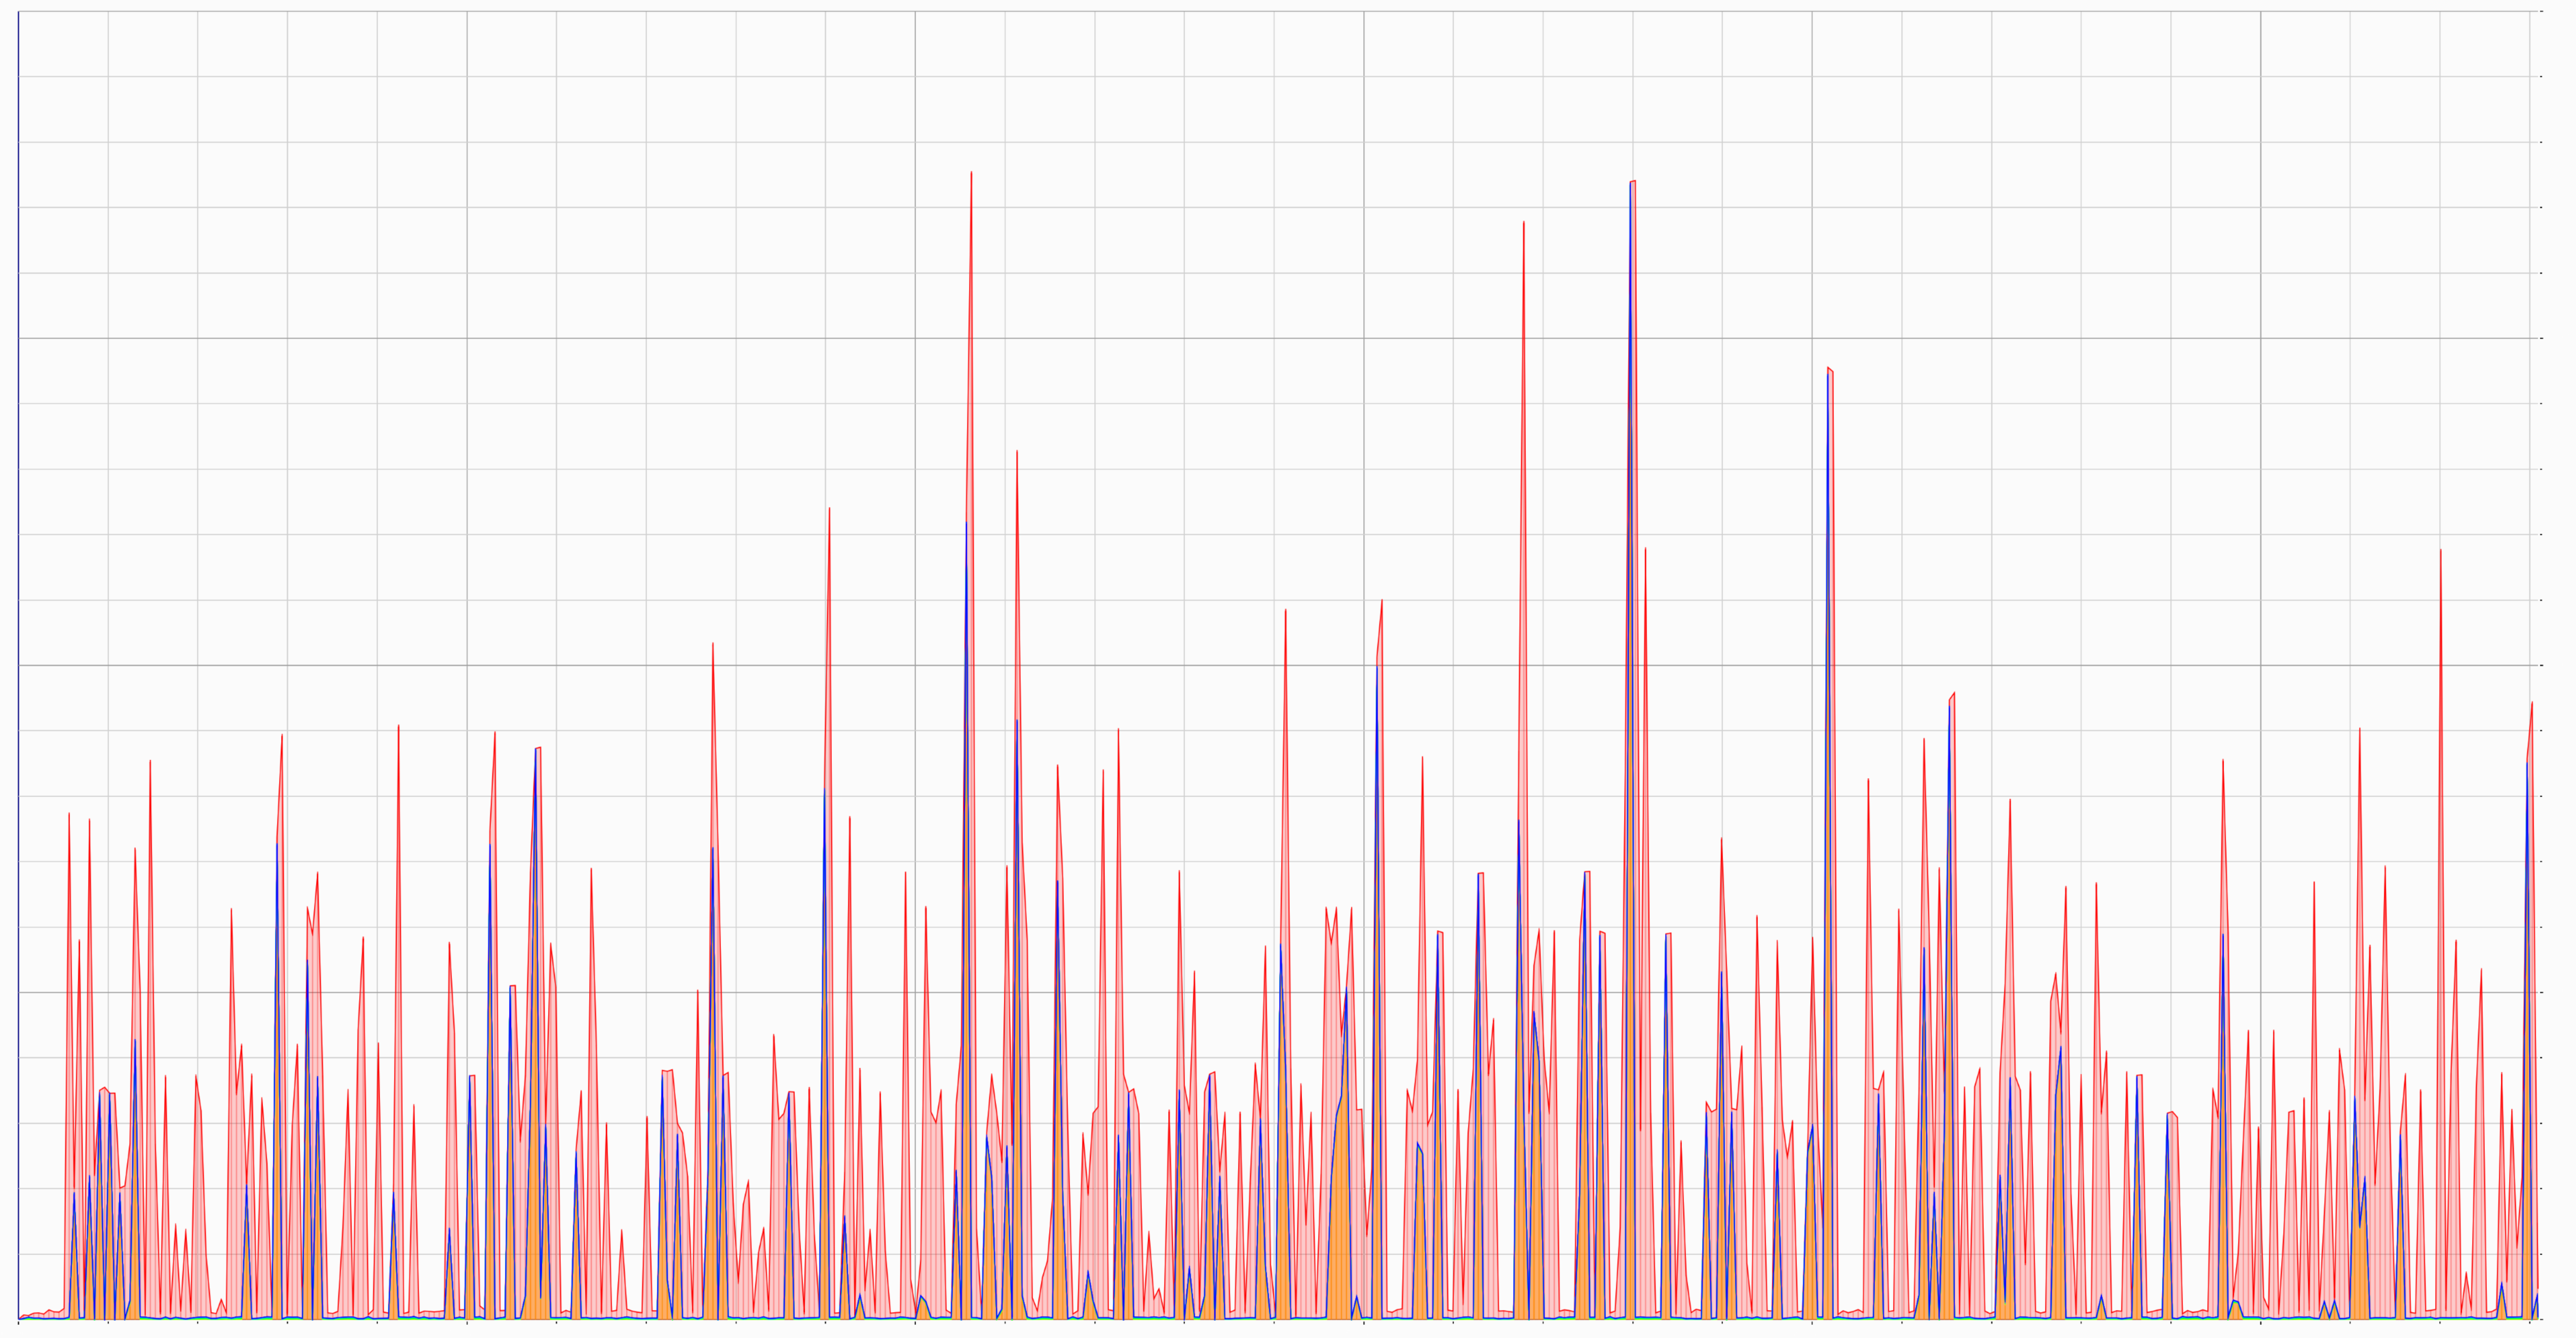
Graph showing memory usage over time
What the hell was going on? The memory usage was not growing, but the grafana dashboard showed me it was. At this point, I’ve started to doubt my sanity - was I seeing things? Was I going crazy?
My colleague pointed out the fact that we are using jemalloc and the heaptrack was tracing glibc functions - maybe that was the problem?
The hunt goes on - using jemalloc profiling
Link to heading
This is where using a custom allocator shines. jemalloc has a nice feature for profiling and leak detection that can be enabled at runtime.
Inspired by greptime’s blog entry we had to add an additional endpoint to the application that would enable us to create a heap profile and check for leaks or excessive memory usage.
    let bytes = CString::new(path.as_str())
        .map_err(|_| anyhow::anyhow!("failed to convert dump path to CString"))?
        .into_bytes_with_nul();

    {
        // #safety: we always expect a valid temp file path to write profiling data to.
        let ptr = bytes.as_ptr() as *mut c_char;
        unsafe {
            tikv_jemalloc_ctl::raw::write(PROF_DUMP, ptr)
                .context(anyhow::anyhow!("write prof.dump"))?;
        }
    }
And enabled the profiling using jemalloc environment variables:
_RJEM_MALLOC_CONF=prof_leak:true,prof:true,lg_prof_interval:28,lg_prof_sample:0,prof_final:true,prof_prefix:/tmp/leaks/
After some time we had the data in /tmp/leaks/, and I could analyze it using jemalloc tools.
So, at that time, we can download memory dump from the container and analyze it on the host using jeprof:
# show the leak summary downlaaded from /tmp/leaks saved there on application exit
jeprof --show_bytes target/release/imaginator jeprof.1167226.0.f.heap

# download the memory dump from the container (we can use 2 dumps to compare them)
kubectl exec pod_name --container=app -it -- curl 127.0.0.1:3000/dump_profile > dumps/heap_$(date +%Y-%m-%d_%H-%M-%S)up_a_lot2.profile

# prepare the flamegraph from
docker run -v $PWD/dumps:/dumps -it imaginator:latest jeprof /bin/imaginator \
    --base /dumps/heap_2024-08-01_14-24-00_drop_yet_again.profile \
    /dumps/heap_2024-08-01_14-28-31_slight_up.profile --collapse  | flamegraph.pl
jeprof presented as flamegraph showed me that the memory was stable over time and there were no leaks.
What the fuck was going on? Was I going crazy?
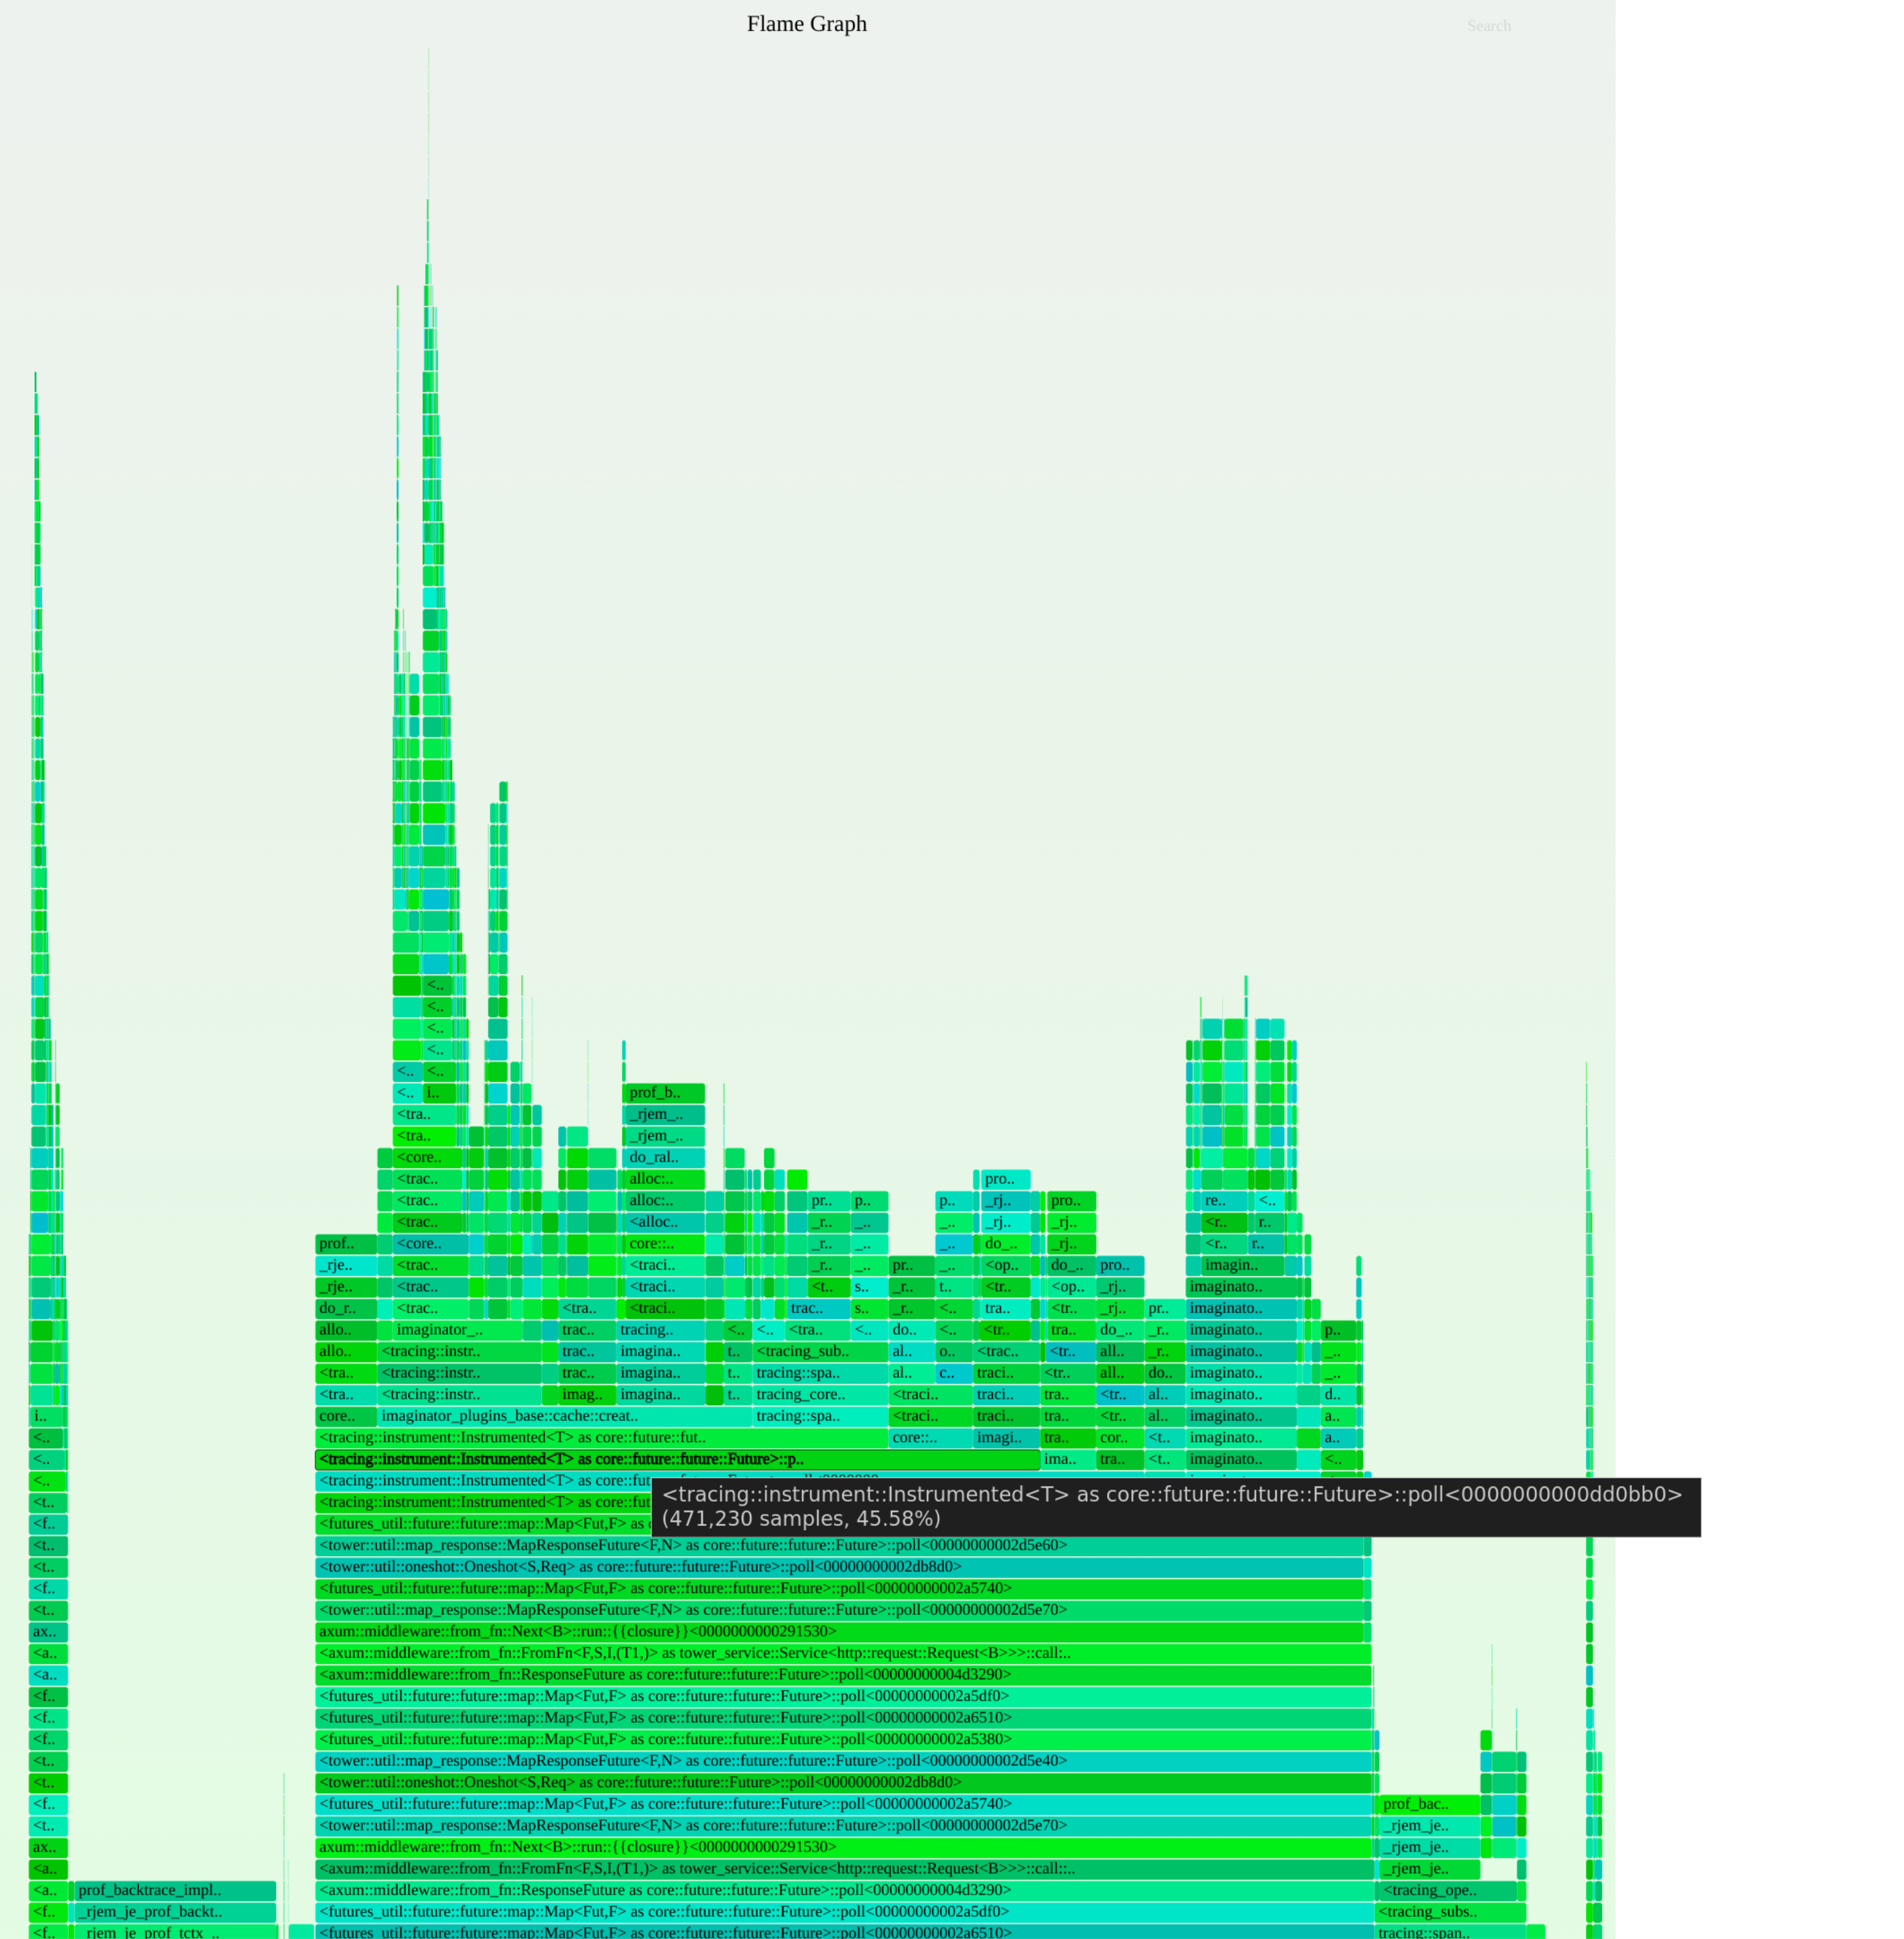
Differential flamegraph of memory allocations measured by sampling by jemalloc
Questioning our assumptions Link to heading
At this point I was pretty sure that either we are not tracing the right things or our assumptions are incorrect. I wanted to use the same tools I would use on my host to see memory usage.
To decrease attack surface we are building very minimal images using nixos:
      dockerImage = pkgs.dockerTools.buildImage {
        name = imaginatorDeps.pname;
        fromImage = base;
        tag = imaginatorDeps.version;
        copyToRoot = [ imaginator pkgs.cacert pkgs.jemalloc pkgs.perl pkgs.gnutar ];
        created = "now";
        config = {
          WorkingDir = "/app";
          Cmd = [ "${imaginator}/bin/imaginator" ];
        };
      };
I’ve added coreutils to ship binaries like free and pmap to investigate /proc filesystem.
Funnily enough, after running pmamp the solution has become obvious.
There were no leaks in the application, but the metrics were lying!
The solution Link to heading
I quickly confirmed my suspicions by checking how the grafana dashboard calculated the memory usage.
sum(container_memory_working_set_bytes{container="app", pod=~"$pod", namespace=~"$namespace"}) by (pod) / sum(kube_pod_container_resource_limits{job="kube-state-metrics", resource="memory", pod=~"$pod", namespace=~"$namespace"}) by (pod)
container_memory_working_set_bytes is defined by documentation as:
Current working set of the container in bytes
And in cAdvisor source code we can see that it’s defined as:
// The amount of working set memory, this includes recently accessed memory,
// dirty memory, and kernel memory. Working set is <= "usage".
// Units: Bytes.
WorkingSet uint64 `json:"working_set"`
And calculated as:
	workingSet := ret.Memory.Usage
	if v, ok := s.MemoryStats.Stats[inactiveFileKeyName]; ok {
		ret.Memory.TotalInactiveFile = v
		if workingSet < v {
			workingSet = 0
		} else {
			workingSet -= v
		}
	}
	ret.Memory.WorkingSet = workingSet
Where stats are created as: cgroupStats, err := h.cgroupManager.GetStats() which in turn is defined in libcontainer as:
func statMemory(dirPath string, stats *cgroups.Stats) error {
    // ...
    memoryUsage, err := getMemoryDataV2(dirPath, "")
    // ...
    stats.MemoryStats.Usage = memoryUsage
    // ...

func getMemoryDataV2(path, name string) (cgroups.MemoryData, error) {
	memoryData := cgroups.MemoryData{}

	moduleName := "memory"
	if name != "" {
		moduleName = "memory." + name
	}
	usage := moduleName + ".current"
	limit := moduleName + ".max"
	maxUsage := moduleName + ".peak"

	value, err := fscommon.GetCgroupParamUint(path, usage)
	// error handling ...
	memoryData.Usage = value
// ...
These are defined in cgroup v2 kernel docs and rhel docs:
memory.current
	The total amount of memory currently being used by the cgroup
	and its descendants.
inactive_anon, active_anon, inactive_file, active_file, unevictable
	Amount of memory, swap-backed and filesystem-backed,
	on the internal memory management lists used by the
	page reclaim algorithm

# by rhel
Active(file) — The amount of file cache memory, in kibibytes, that is in active use, or was in active use since the last time the system reclaimed memory.
Inactive(file) — The amount of file cache memory, in kibibytes, that is newly loaded from the disk, or is a candidate for reclaiming.
Let’s test if we understand the data correctly:
# cat /proc/self/cgroup
0::/kubepods.slice/kubepods-burstable.slice/kubepods-burstable-pod691b95b6_30e7_4d49_bf58_1a819d5d0bf9.slice/cri-containerd-84603383846696291f6916b1508a34a8009a458b4639d18f5f763b4ccb1b1ebc.scope
# cat //sys/fs/cgroup//kubepods.slice/kubepods-burstable.slice/kubepods-burstable-pod691b95b6_30e7_4d49_bf58_1a819d5d0bf9.slice/memory.current
11630465024
# cat //sys/fs/cgroup//kubepods.slice/kubepods-burstable.slice/kubepods-burstable-pod691b95b6_30e7_4d49_bf58_1a819d5d0bf9.slice/memory.stat | grep inactive_file
inactive_file 996245504
# exit

❯ echo "scale=2; (11630465024 - 996245504) / 1024 / 1024" | bc
10141.58

# taken couple seconds later
❯ kubectl top pod pod_name
NAME                           CPU(cores)   MEMORY(bytes)
pod-name                       327m         10194Mi
So the container_memory_working_set_bytes is not the memory usage of the container without cache but the memory usage of the container with cache but without the inactive file cache.
There is no leak in the application - the metrics dashboard was lying to us!
In our case, high active_file values (cache usage) are not a problem - it’s a feature since we rely on the filesystem cache to avoid duplicating the image processing.
Monitoring container_memory_working_set_bytes still makes sense since it is the metric that kublet uses to kill the pod when it exceeds the limits.
However, after getting a better grasp of the matters, we decided to add additional alerts for residents with a set size of the application to catch potential bugs in the future.
Conclusion Link to heading
The memory leak that wasn’t there was a phantom menace that almost broke me. Over the week I’ve struggled with the problem that wasn’t there - the resident memory of the application was stable over time.
I’ve learned a lot about how the memory metrics are calculated in kubernetes and how to debug memory usage in containers. Here are my takeaways:
- Define the problem and how has it been measured at the beginning. Don’t jump to conclusions.
- Do not trust your instincts. We have spent a couple days trying to recreate the problem on our local machines - but the problem was my misunderstanding.
- Write down the hypothesis.
- Test it using the tools you have.
- If the tools are not enough - add more tools.
- If the hypothesis is wrong - go back to step 1.
- Note everything you do - it’s easy to forget what you’ve tried and what you’ve learned. I’ve wasted a lot of time repeating the same steps because I’ve forgotten I’ve already tried them.
- Talk to your colleagues - they might have a different perspective on the problem and can help you see it from a different angle.
- When you hear hoofbeats, think of horses, not zebras. More often then not, the problem is not in the FFI code, which has worked for years.
- Try to understand how the metrics are calculated - computers are complex, and over simplification has led me to the wrong conclusion.
- Don’t give up - the problem is there; you must find it.
It’s a bad joke, I’m sorry. It’s been pointed out to me that I should be more explicit about it. And u/memoryruins kindly pointed out that memory leaks are possible in rust - even in safe rust by using
mem::forget. Additionally, types likeString,Box,Rchave ways to leak memory.Nomicon “The Dark Arts of Unsafe Rust” has an amazing resource, Leaking, on how and why we can get even more leaks. ↩︎