Why measure memory usage Link to heading
Memory is costly, cloud providers differentiate the services based on CPU/disk/network and memory. Measuring how much memory the application takes is a very useful skill.
Example problem Link to heading
The premise of this blog post is to show ways to profile heap usage of a rust application. Application is reading potentially large csv into memory and then storing headers and fields for later access by index. Let’s start an example project:
# the complete source code can be found here:
# https://github.com/FlakM/rustberry/tree/master/heaptrace_csv
cargo new --bin heaptrace_csv
The structures for the above problems:
use std::io::{self, BufRead};

// src/main.rs
#[allow(dead_code)]
struct DataRecord {
    fields: Vec<String>,
}

#[allow(dead_code)]
struct DataSheet {
    headers: Vec<String>,
    rows: Vec<DataRecord>,
}
And the algorithm itself:
// src/main.rs
fn split_str(s: String) -> Vec<String> {
    s.split(',').map(str::to_string).collect()
}


fn main() -> Result<(), Box<dyn std::error::Error>> {
    let file = std::fs::File::open("./example.csv")?;
    let reader = io::BufReader::new(file);
    let mut lines = reader.lines();

    let sheet = DataSheet {
        headers: split_str(lines.next().ok_or("empty header")??),
        rows: lines
            .map(|l| DataRecord {
                fields: split_str(l.unwrap()),
            })
            .collect(),
    };
    Ok(())
}
The program creates BufReader buffering lines from example.csv which is:
❯ du -h example.csv
976K    example.csv
❯ wc -l example.csv
12427 example.csv
Measuring Link to heading
To measure memory usage of a process on linux we might use pmap but
to do so we have to add something that will make our program wait for
the measuring. Let’s add simple sleep at the end of main method:
// end of main method
std::thread::sleep(std::time::Duration::from_secs(10))
So to ease the process of understanding memory address we might want to disable Address space layout randomization ASLR. It’s a technique used by os to introduce some randomness into the address space of a process to make life harder for those naughty hackers.
As a side note one might think you would think that it’s possible before preparing the output again and again…
# read https://askubuntu.com/questions/318315/how-can-i-temporarily-disable-aslr-address-space-layout-randomization
# for more information
echo 0 | sudo tee /proc/sys/kernel/randomize_va_space
# to enable it back on after having fun:
echo 2 | sudo tee /proc/sys/kernel/randomize_va_space
And then we can measure the output using pmap:
❯ cargo run -q --release &

❯ pmap -x $(pgrep heaptrace_csv)

81044:   /home/flakm/programming/flakm/rustberry/target/release/heaptrace_csv
Adres                 KB     RSS  Brudne Tryb  Odwzorowanie
0000555555554000      28      28       0 r---- heaptrace_csv
000055555555b000     228     228       0 r-x-- heaptrace_csv
0000555555594000      56      56       0 r---- heaptrace_csv
00005555555a2000      16      16      16 r---- heaptrace_csv
00005555555a6000       4       4       4 rw--- heaptrace_csv
00005555555a7000    5080    5052    5052 rw---   [ anon ]
00007ffff7d19000     388     292     292 rw---   [ anon ]
00007ffff7dab000       4       0       0 -----   [ anon ]
00007ffff7dac000      16       8       8 rw---   [ anon ]
00007ffff7db0000     152     148       0 r---- libc-2.33.so
00007ffff7dd6000    1352     796       0 r-x-- libc-2.33.so
00007ffff7f28000     312     156       0 r---- libc-2.33.so
00007ffff7f76000      12      12      12 r---- libc-2.33.so
00007ffff7f79000      12      12      12 rw--- libc-2.33.so
00007ffff7f7c000      36      12      12 rw---   [ anon ]
00007ffff7f85000       4       4       0 r---- libdl-2.33.so
00007ffff7f86000       4       4       0 r-x-- libdl-2.33.so
00007ffff7f87000       4       0       0 r---- libdl-2.33.so
00007ffff7f88000       4       4       4 r---- libdl-2.33.so
00007ffff7f89000       4       4       4 rw--- libdl-2.33.so
00007ffff7f8a000      28      28       0 r---- libpthread-2.33.so
00007ffff7f91000      56      56       0 r-x-- libpthread-2.33.so
00007ffff7f9f000      20       0       0 r---- libpthread-2.33.so
00007ffff7fa4000       4       4       4 r---- libpthread-2.33.so
00007ffff7fa5000       4       4       4 rw--- libpthread-2.33.so
00007ffff7fa6000      16       4       4 rw---   [ anon ]
00007ffff7faa000      12      12       0 r---- libgcc_s.so.1
00007ffff7fad000      68      64       0 r-x-- libgcc_s.so.1
00007ffff7fbe000      12      12       0 r---- libgcc_s.so.1
00007ffff7fc1000       4       0       0 ----- libgcc_s.so.1
00007ffff7fc2000       4       4       4 r---- libgcc_s.so.1
00007ffff7fc3000       4       4       4 rw--- libgcc_s.so.1
00007ffff7fc4000       8       8       8 rw---   [ anon ]
00007ffff7fc6000      16       0       0 r----   [ anon ]
00007ffff7fca000       8       4       0 r-x--   [ anon ]
00007ffff7fcc000       4       4       0 r---- ld-2.33.so
00007ffff7fcd000     144     144       0 r-x-- ld-2.33.so
00007ffff7ff1000      40      40       0 r---- ld-2.33.so
00007ffff7ffb000       8       8       8 r---- ld-2.33.so
00007ffff7ffd000       8       8       8 rw--- ld-2.33.so
00007ffffffd1000     184      64      64 rw---   [ stos ]
ffffffffff600000       4       0       0 --x--   [ anon ]
---------------- ------- ------- -------
razem kB            8372    7308    5524
The process is using 8372 kB of memory.
So we can filter out some shared libraries (files with extension .so) and
focus on anon sections. From
man page:
Memory not relating to any named object or file within the file system is reported as [ anon ]. If the common name for the mapping is unknown, pmap displays [ anon ] as the mapping name.
Lets focus on anon pages then:
❯ pmap -x $(pgrep heaptrace_csv) | grep anon | awk '{sum+=$2;}END{print sum;}'

5576
It sums to 5676kB. That is 5 times the size of the file itself!
Let’s add some little pointers printed out to help us identify the regions:
let zero = 0;
let vec_start = sheet.rows.as_ptr();
let vec_stop = unsafe { vec_start.add(sheet.rows.len()) };
let main_ptr = main as *const ();
let stack_ptr = &zero;

println!("vec_start:  {vec_start:p}");
println!("vec_stop:  {vec_stop:p}");
println!("vec_capacity:  {}", sheet.rows.capacity());
println!("code:  {main_ptr:p}");
println!("stack: {stack_ptr:p}");
std::thread::sleep(std::time::Duration::from_secs(60));
println!("done sleeping...");

// this will output:
//❯ cargo run -q --release
//vec_start:  0x7ffff7d19010
//vec_stop:  0x7ffff7d61d00
//vec_capacity:  16384
//code:  0x55555555dc50
//stack: 0x7fffffff0854
// done sleeping...
Also let’s check system calls:
$ strace -o strace.log -f ../target/release/heaptrace_csv
$ grep -E "brk|.*map\(NULL.*ANONYMOUS|m.+map" strace.log

81944 brk(NULL)                         = 0x5555555a7000
81944 mmap(NULL, 8192, PROT_READ|PROT_WRITE, MAP_PRIVATE|MAP_ANONYMOUS, -1, 0) = 0x7ffff7fc4000
81944 mmap(NULL, 8192, PROT_READ|PROT_WRITE, MAP_PRIVATE|MAP_ANONYMOUS, -1, 0) = 0x7ffff7dae000
81944 mmap(NULL, 12288, PROT_READ|PROT_WRITE, MAP_PRIVATE|MAP_ANONYMOUS|MAP_STACK, -1, 0) = 0x7ffff7dab000
81944 brk(NULL)                         = 0x5555555a7000
81944 brk(0x5555555c8000)               = 0x5555555c8000
81944 brk(0x5555555e9000)               = 0x5555555e9000
81944 brk(0x55555560a000)               = 0x55555560a000
81944 brk(0x55555562b000)               = 0x55555562b000
81944 brk(0x55555564c000)               = 0x55555564c000
81944 brk(0x55555566d000)               = 0x55555566d000
81944 brk(0x55555568e000)               = 0x55555568e000
81944 brk(0x5555556bf000)               = 0x5555556bf000
81944 brk(0x5555556e0000)               = 0x5555556e0000
81944 brk(0x555555701000)               = 0x555555701000
81944 brk(0x555555722000)               = 0x555555722000
81944 brk(0x555555743000)               = 0x555555743000
81944 brk(0x555555764000)               = 0x555555764000
81944 mmap(NULL, 200704, PROT_READ|PROT_WRITE, MAP_PRIVATE|MAP_ANONYMOUS, -1, 0) = 0x7ffff7d7a000
81944 brk(0x555555785000)               = 0x555555785000
81944 brk(0x5555557a6000)               = 0x5555557a6000
81944 brk(0x5555557c7000)               = 0x5555557c7000
81944 brk(0x5555557e8000)               = 0x5555557e8000
81944 brk(0x555555809000)               = 0x555555809000
81944 brk(0x55555582a000)               = 0x55555582a000
81944 brk(0x55555584b000)               = 0x55555584b000
81944 brk(0x55555586c000)               = 0x55555586c000
81944 brk(0x55555588d000)               = 0x55555588d000
81944 brk(0x5555558ae000)               = 0x5555558ae000
81944 brk(0x5555558cf000)               = 0x5555558cf000
81944 brk(0x5555558f0000)               = 0x5555558f0000
81944 mremap(0x7ffff7d7a000, 200704, 397312, MREMAP_MAYMOVE) = 0x7ffff7d19000
81944 brk(0x555555911000)               = 0x555555911000
81944 brk(0x555555932000)               = 0x555555932000
81944 brk(0x555555953000)               = 0x555555953000
81944 brk(0x555555974000)               = 0x555555974000
81944 brk(0x555555995000)               = 0x555555995000
81944 brk(0x5555559b6000)               = 0x5555559b6000
81944 brk(0x5555559d7000)               = 0x5555559d7000
81944 brk(0x5555559f8000)               = 0x5555559f8000
81944 brk(0x555555a19000)               = 0x555555a19000
81944 brk(0x555555a3a000)               = 0x555555a3a000
81944 brk(0x555555a5b000)               = 0x555555a5b000
81944 brk(0x555555a7c000)               = 0x555555a7c000
81944 brk(0x555555a9d000)               = 0x555555a9d000
I believe we can see vec growth in action.
Checkout the line:
51146 mmap(NULL, 200704, PROT_READ|PROT_WRITE, MAP_PRIVATE|MAP_ANONYMOUS, -1, 0) = 0x7ffff7d7a000
This is mmap call for the vector of rows growing over threshold where
previously it was stored in the same mapping created by brk call:
81944 brk(NULL) = 0x5555555a7000
Then after the code finished iterating over all lines there was a following call:
81944 mremap(0x7ffff7d7a000, 200704, 397312, MREMAP_MAYMOVE) = 0x7ffff7d19000
which coresponds to: (397312 bytes is 388 Kb)
00005555555a7000    5080    5052    5052 rw---   [ anon ]
00007ffff7d19000     388     292     292 rw---   [ anon ]
To understand this value we have to analyze the output of our program
again. For DataSheet allocations for inner Vecs are in different
mapping than the contents of the Vecs:
vec_start:  0x7ffff7d19010
vec_stop:  0x7ffff7d61d00
code:  0x55555555dc50
stack: 0x7fffffff0854
So to calculate the heap size of DataSheet. We have to use
the following equation where x is a number of rows :
size = 24 + x * 24
It gives us exactly 292 Kb for the exact length of the file. But since Vec
is filled in runtime it cannot know the exact length without a hint
hence growing algorithm reserves larger and larger memory blocks using a heuristic.
The component of a Vec containing the information on how many elements
could this Vec hold without new allocation is called capacity.
The capacity that the output of the program gave us for sheet.rows.capacity() was 16384.
So for a system with a page size equal to 4096 we get:
size = 24 + 16384 * 24 = 393400
size_page_aligned = 397312
size_page_aligned_kB = 388
If we factor in the expected size of the Strings from DataRecord which is roughly
estimated by the size of the file itself (976K) plus each String has
it’s own memory cost (24 bytes) that gives us:
lines = 12427
columns = 7
size = 7 * 12427 * 24 = 2087736 = 2038 kB
total_size = 2038Kb + 976kB = 3014kB
So we have in total roughly 3.32MB which is a lower bound since we are not
accounting for the unused capacity of individual Strings - yup they are
just some fancy Vecs - click on the source link.
The more elegant solution - heaptrack Link to heading
The problem with the above solution is that we are tracking
syscalls and memory mappings, not the actual memory usage.
In happy path for smaller allocations using malloc should not result in
syscall but reuse previously booked estate backed by some mapping.
Rust by default uses
std::alloc::System
allocator which uses malloc internally. One could use LD_PRELOAD
to trace back the calls to malloc and free.
Searching for similar tools I’ve found this blog post introducing an awesome library: heaptrack a heap memory profiler for Linux.
Under the hood, heaptrack uses LD_PRELOAD trick
with smart usage of libbacktrace and unw_backtrace to gain allocation context.
Since it instruments malloc and free calls it can be used with rust
binaries without any code changes. Given the debug symbols
are enabled you can pinpoint allocations to specific places in code.
# build with debug symbols
❯ RUSTFLAGS=-g cargo build --release

❯ heaptrack  ../target/release/heaptrace_csv

heaptrack output will be written to "/home/flakm/programming/flakm/rustberry/heaptrace_csv/heaptrack.heaptrace_csv.86078.zst"
starting application, this might take some time...
vec_start:  0x7ffff715d010
vec_stop:  0x7ffff71a5d00
vec_capacity:  16384
code:  0x55555555dc50
stack: 0x7ffffffef404
done sleeping...
heaptrack stats:
        allocations:            111990
        leaked allocations:     0
        temporary allocations:  122
Heaptrack finished! Now run the following to investigate the data:

  heaptrack --analyze "/home/flakm/programming/flakm/rustberry/heaptrace_csv/heaptrack.heaptrace_csv.86078.zst"
Heaptrack output Link to heading
If we execute the code that the output of the above command suggested we will get the following screens to enjoy:
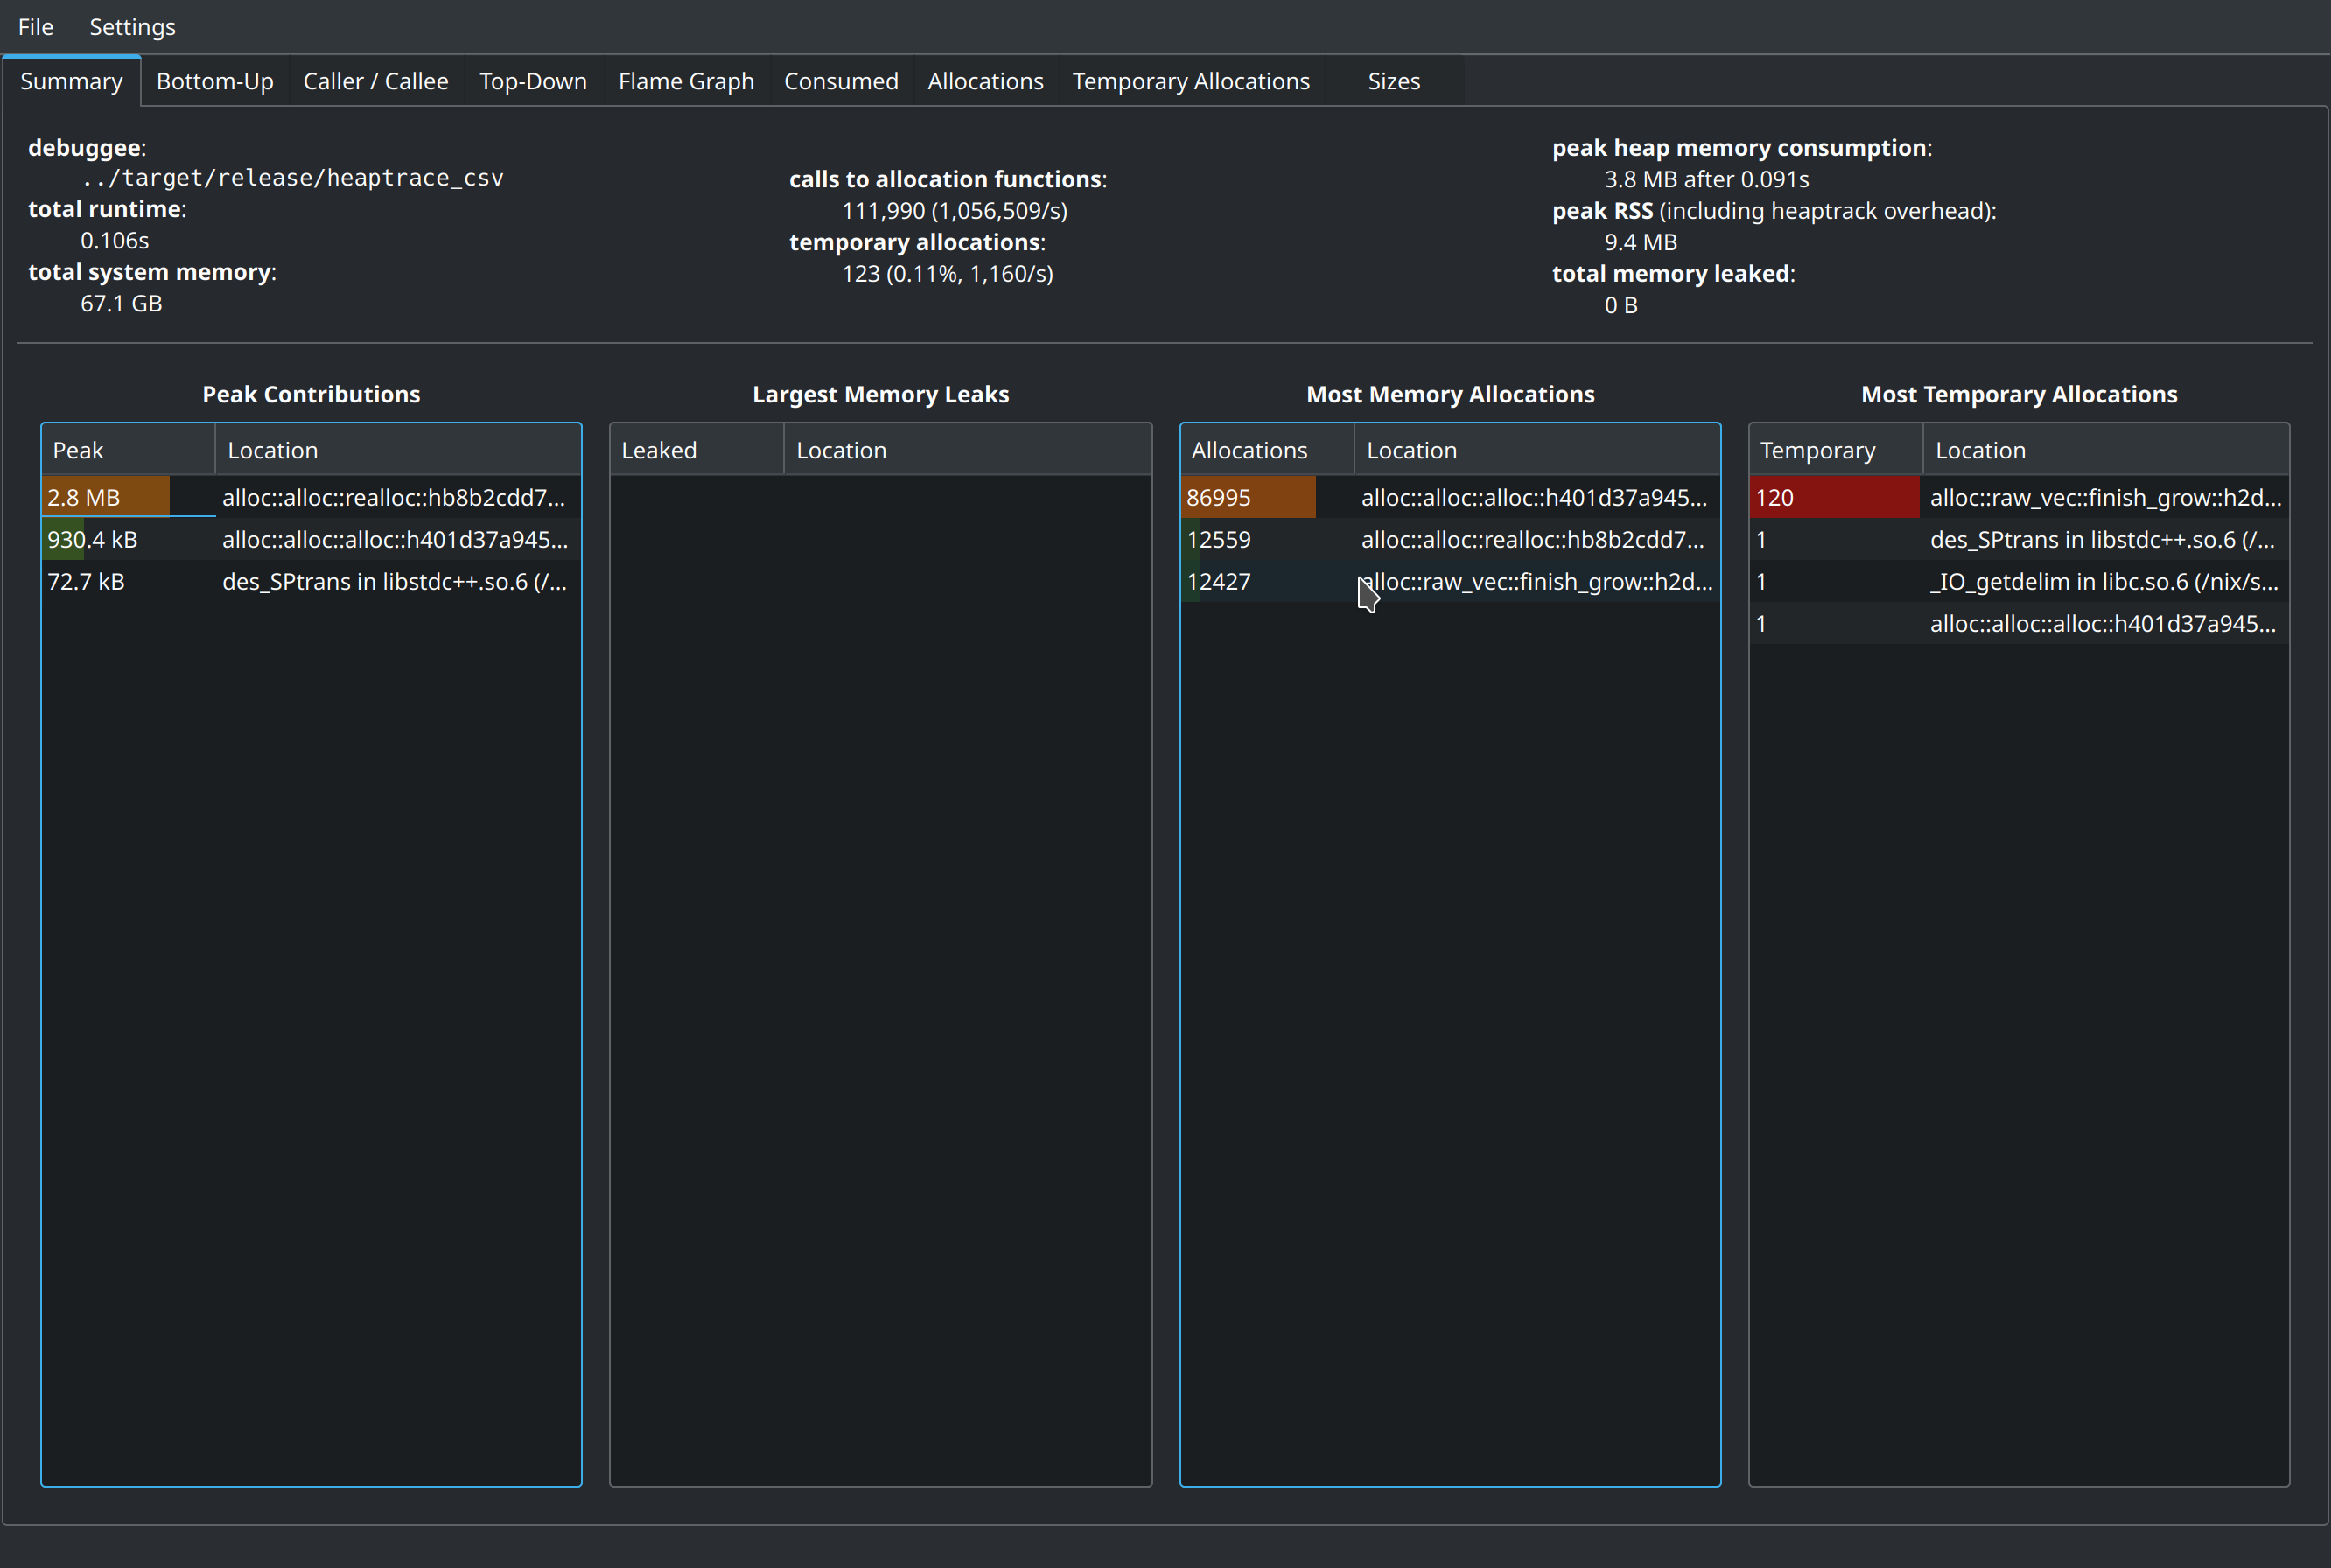
Peak heap memory consumption reported as 3.8MB
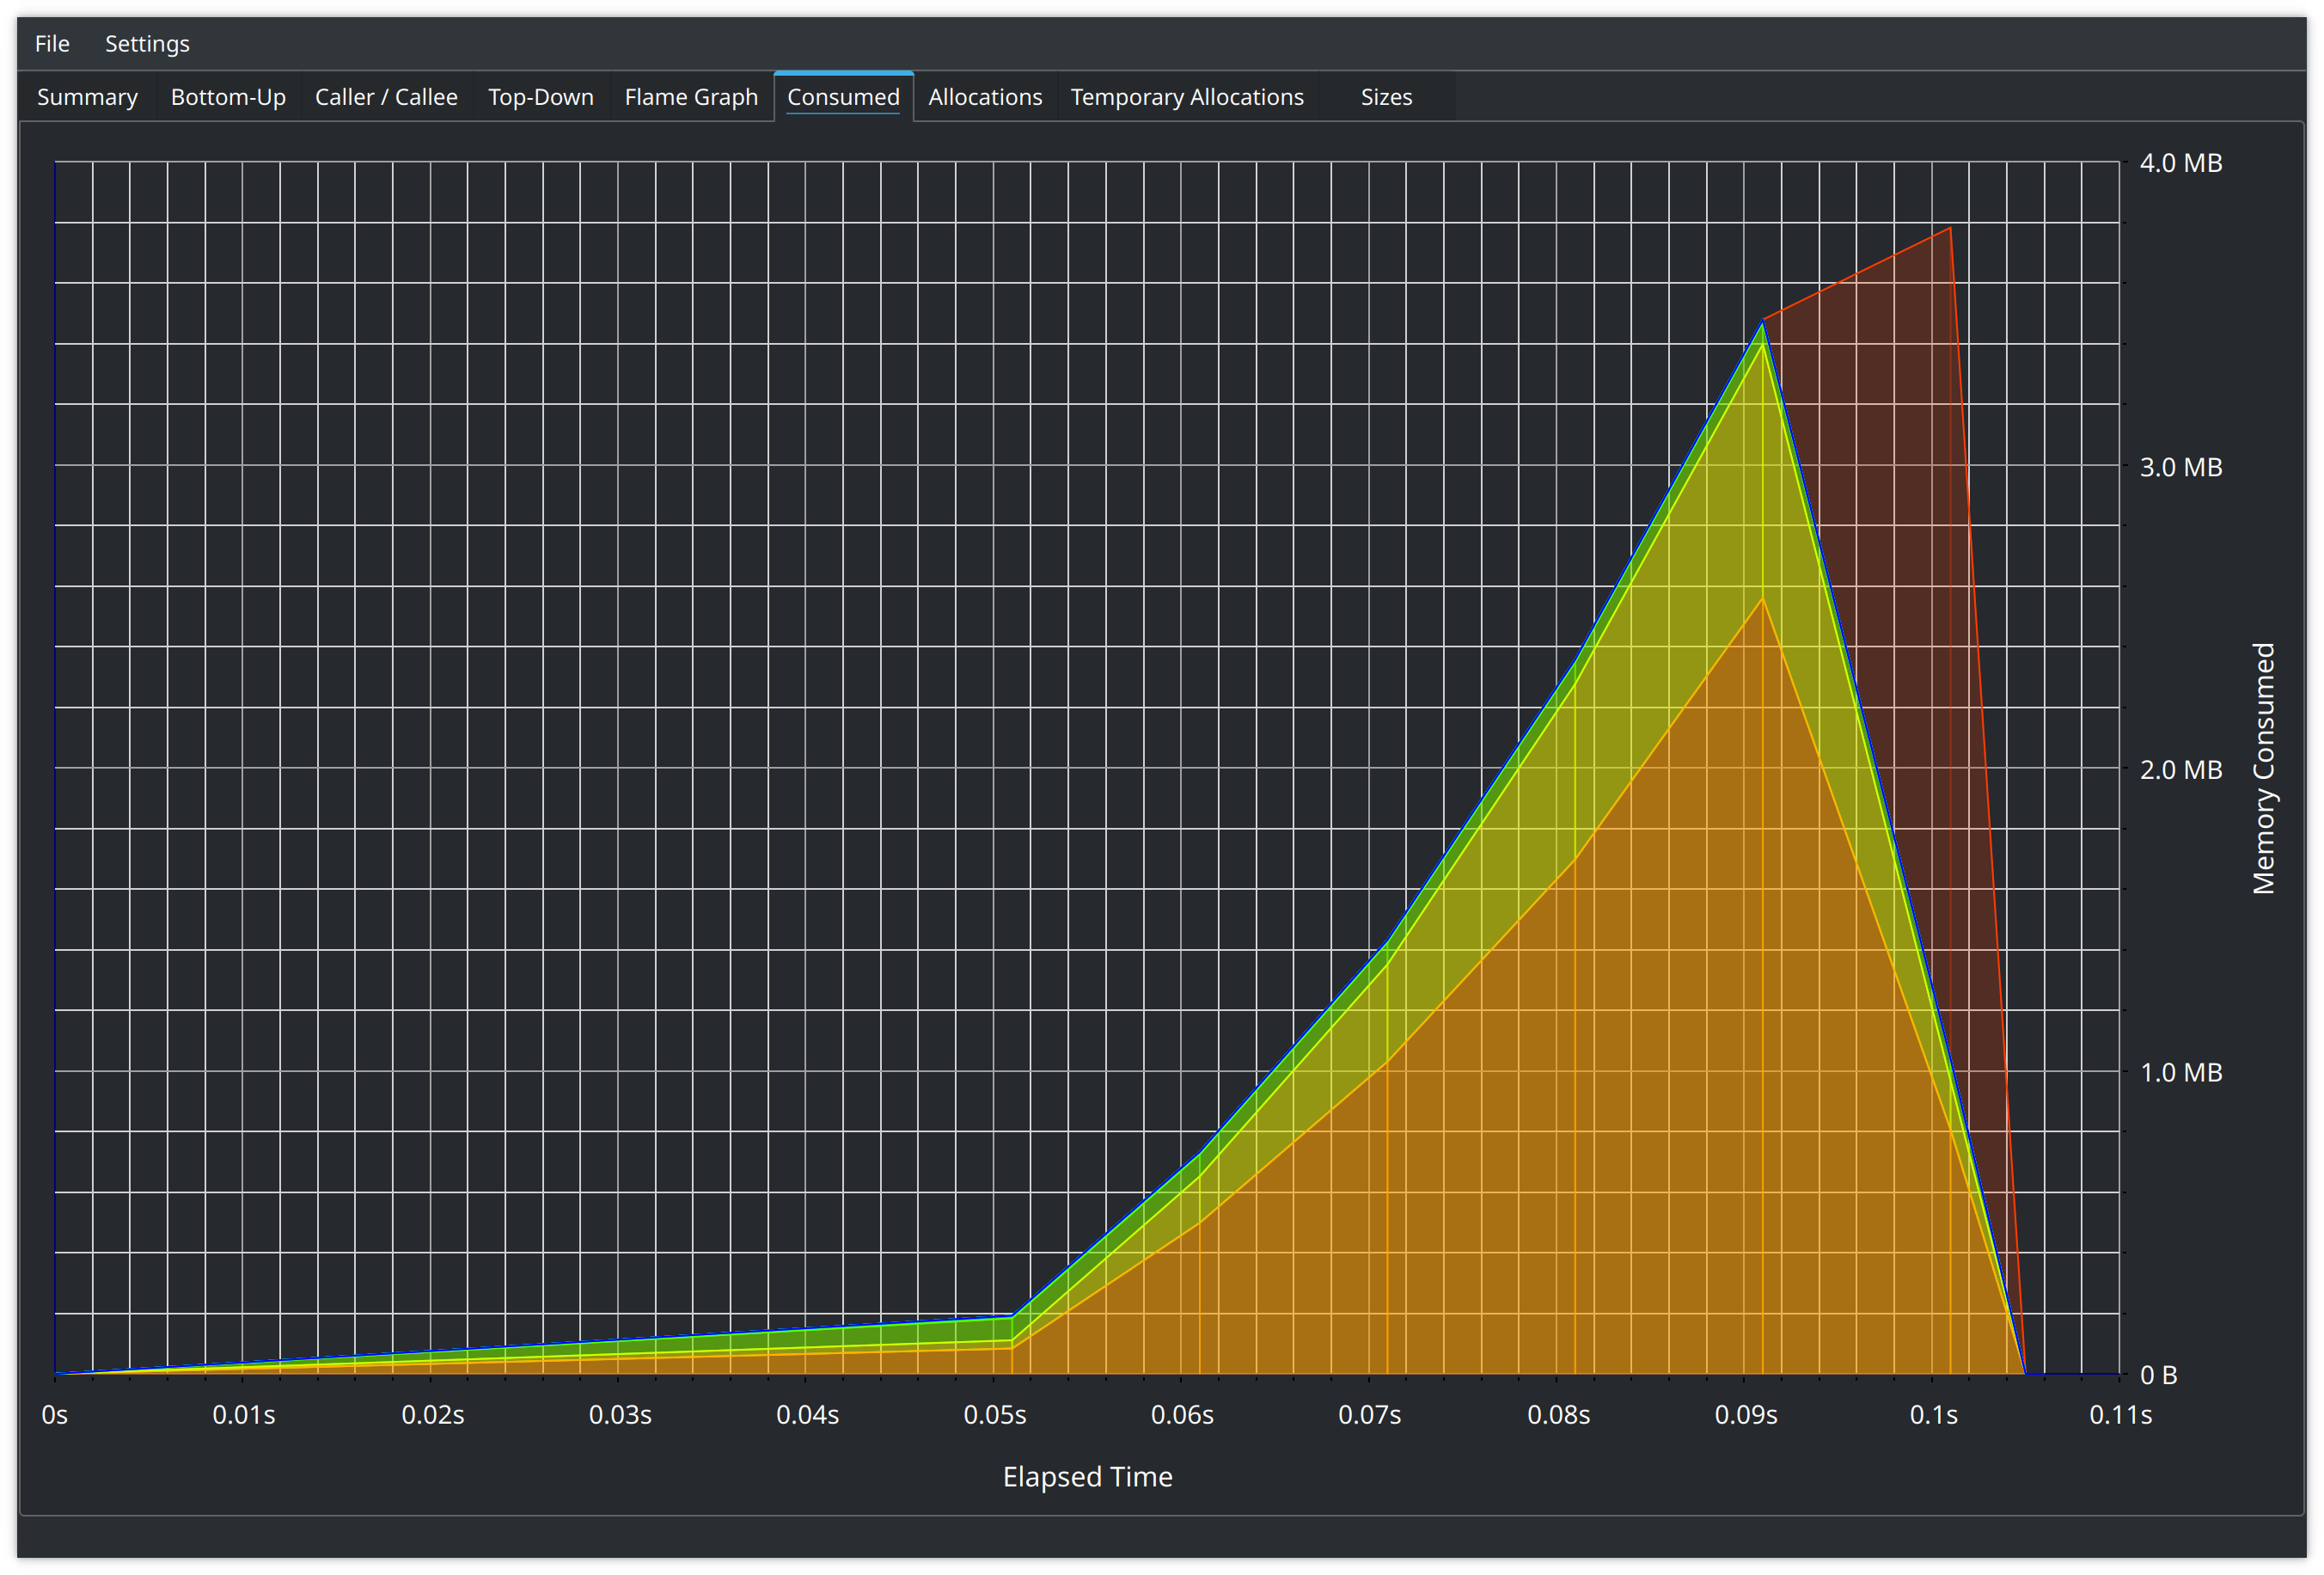
We can see that Flame graph showing the same runtime Total consumption chart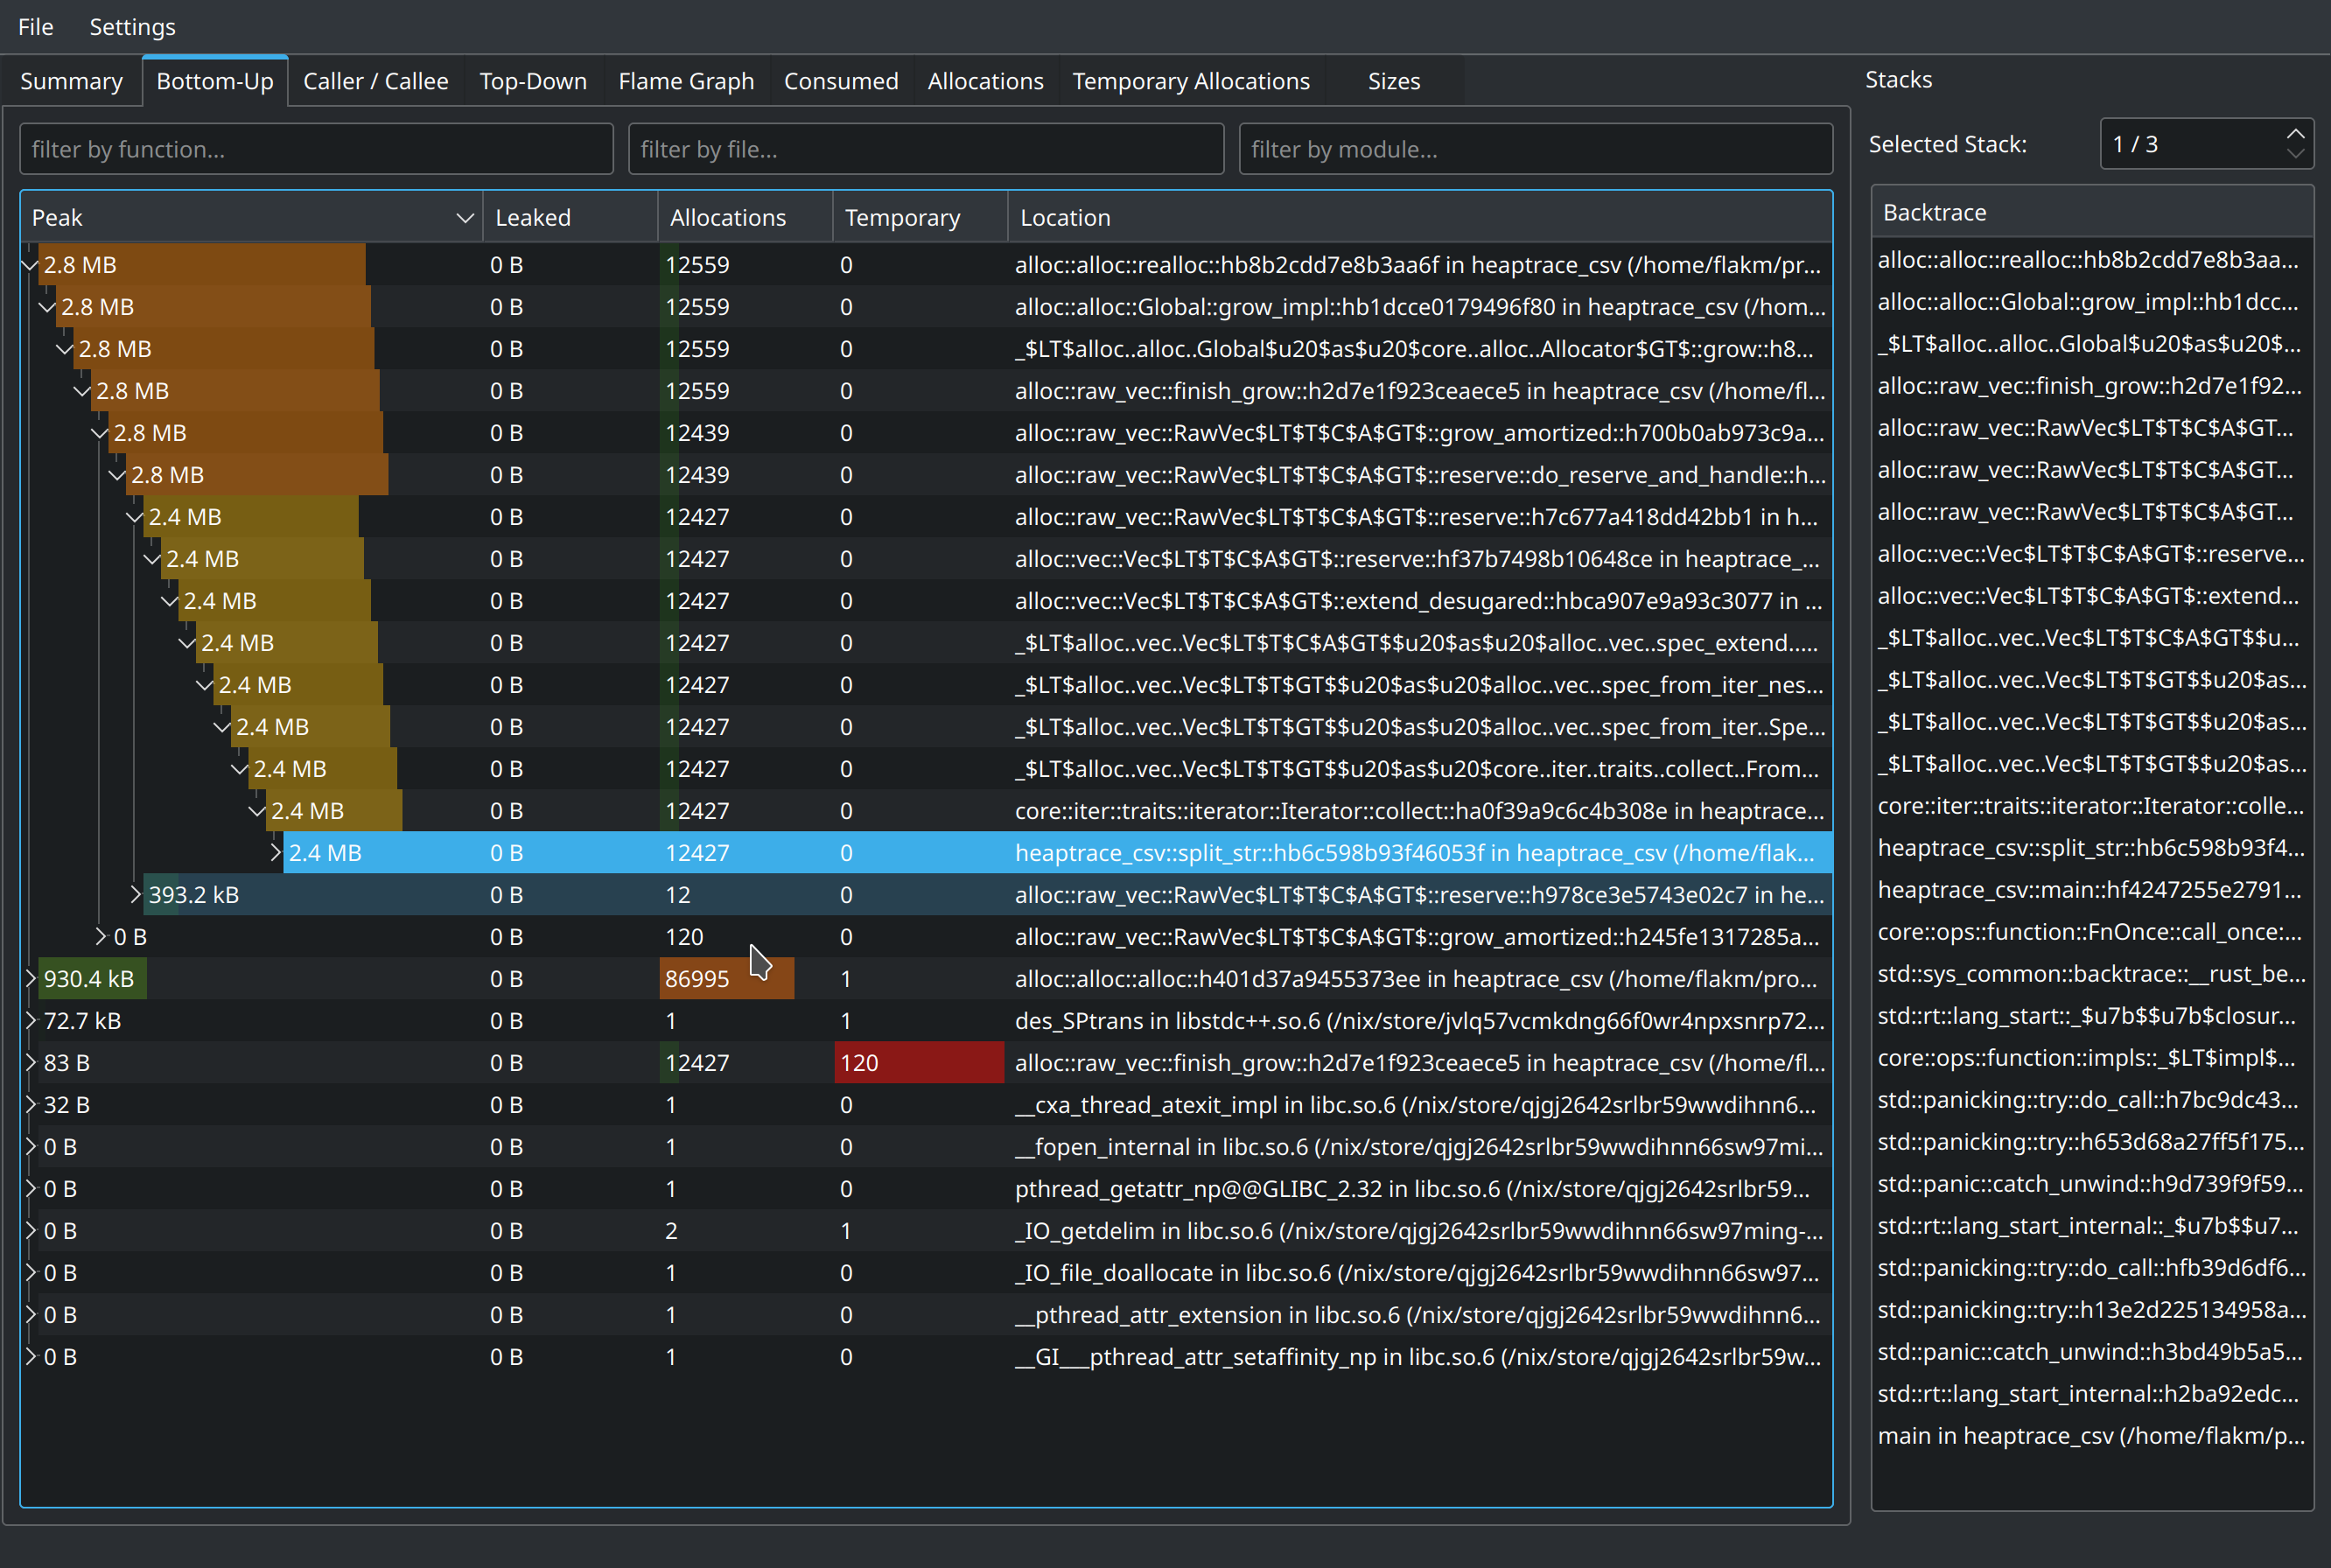
collect called on split_str function results attributed to allocating 2.8MB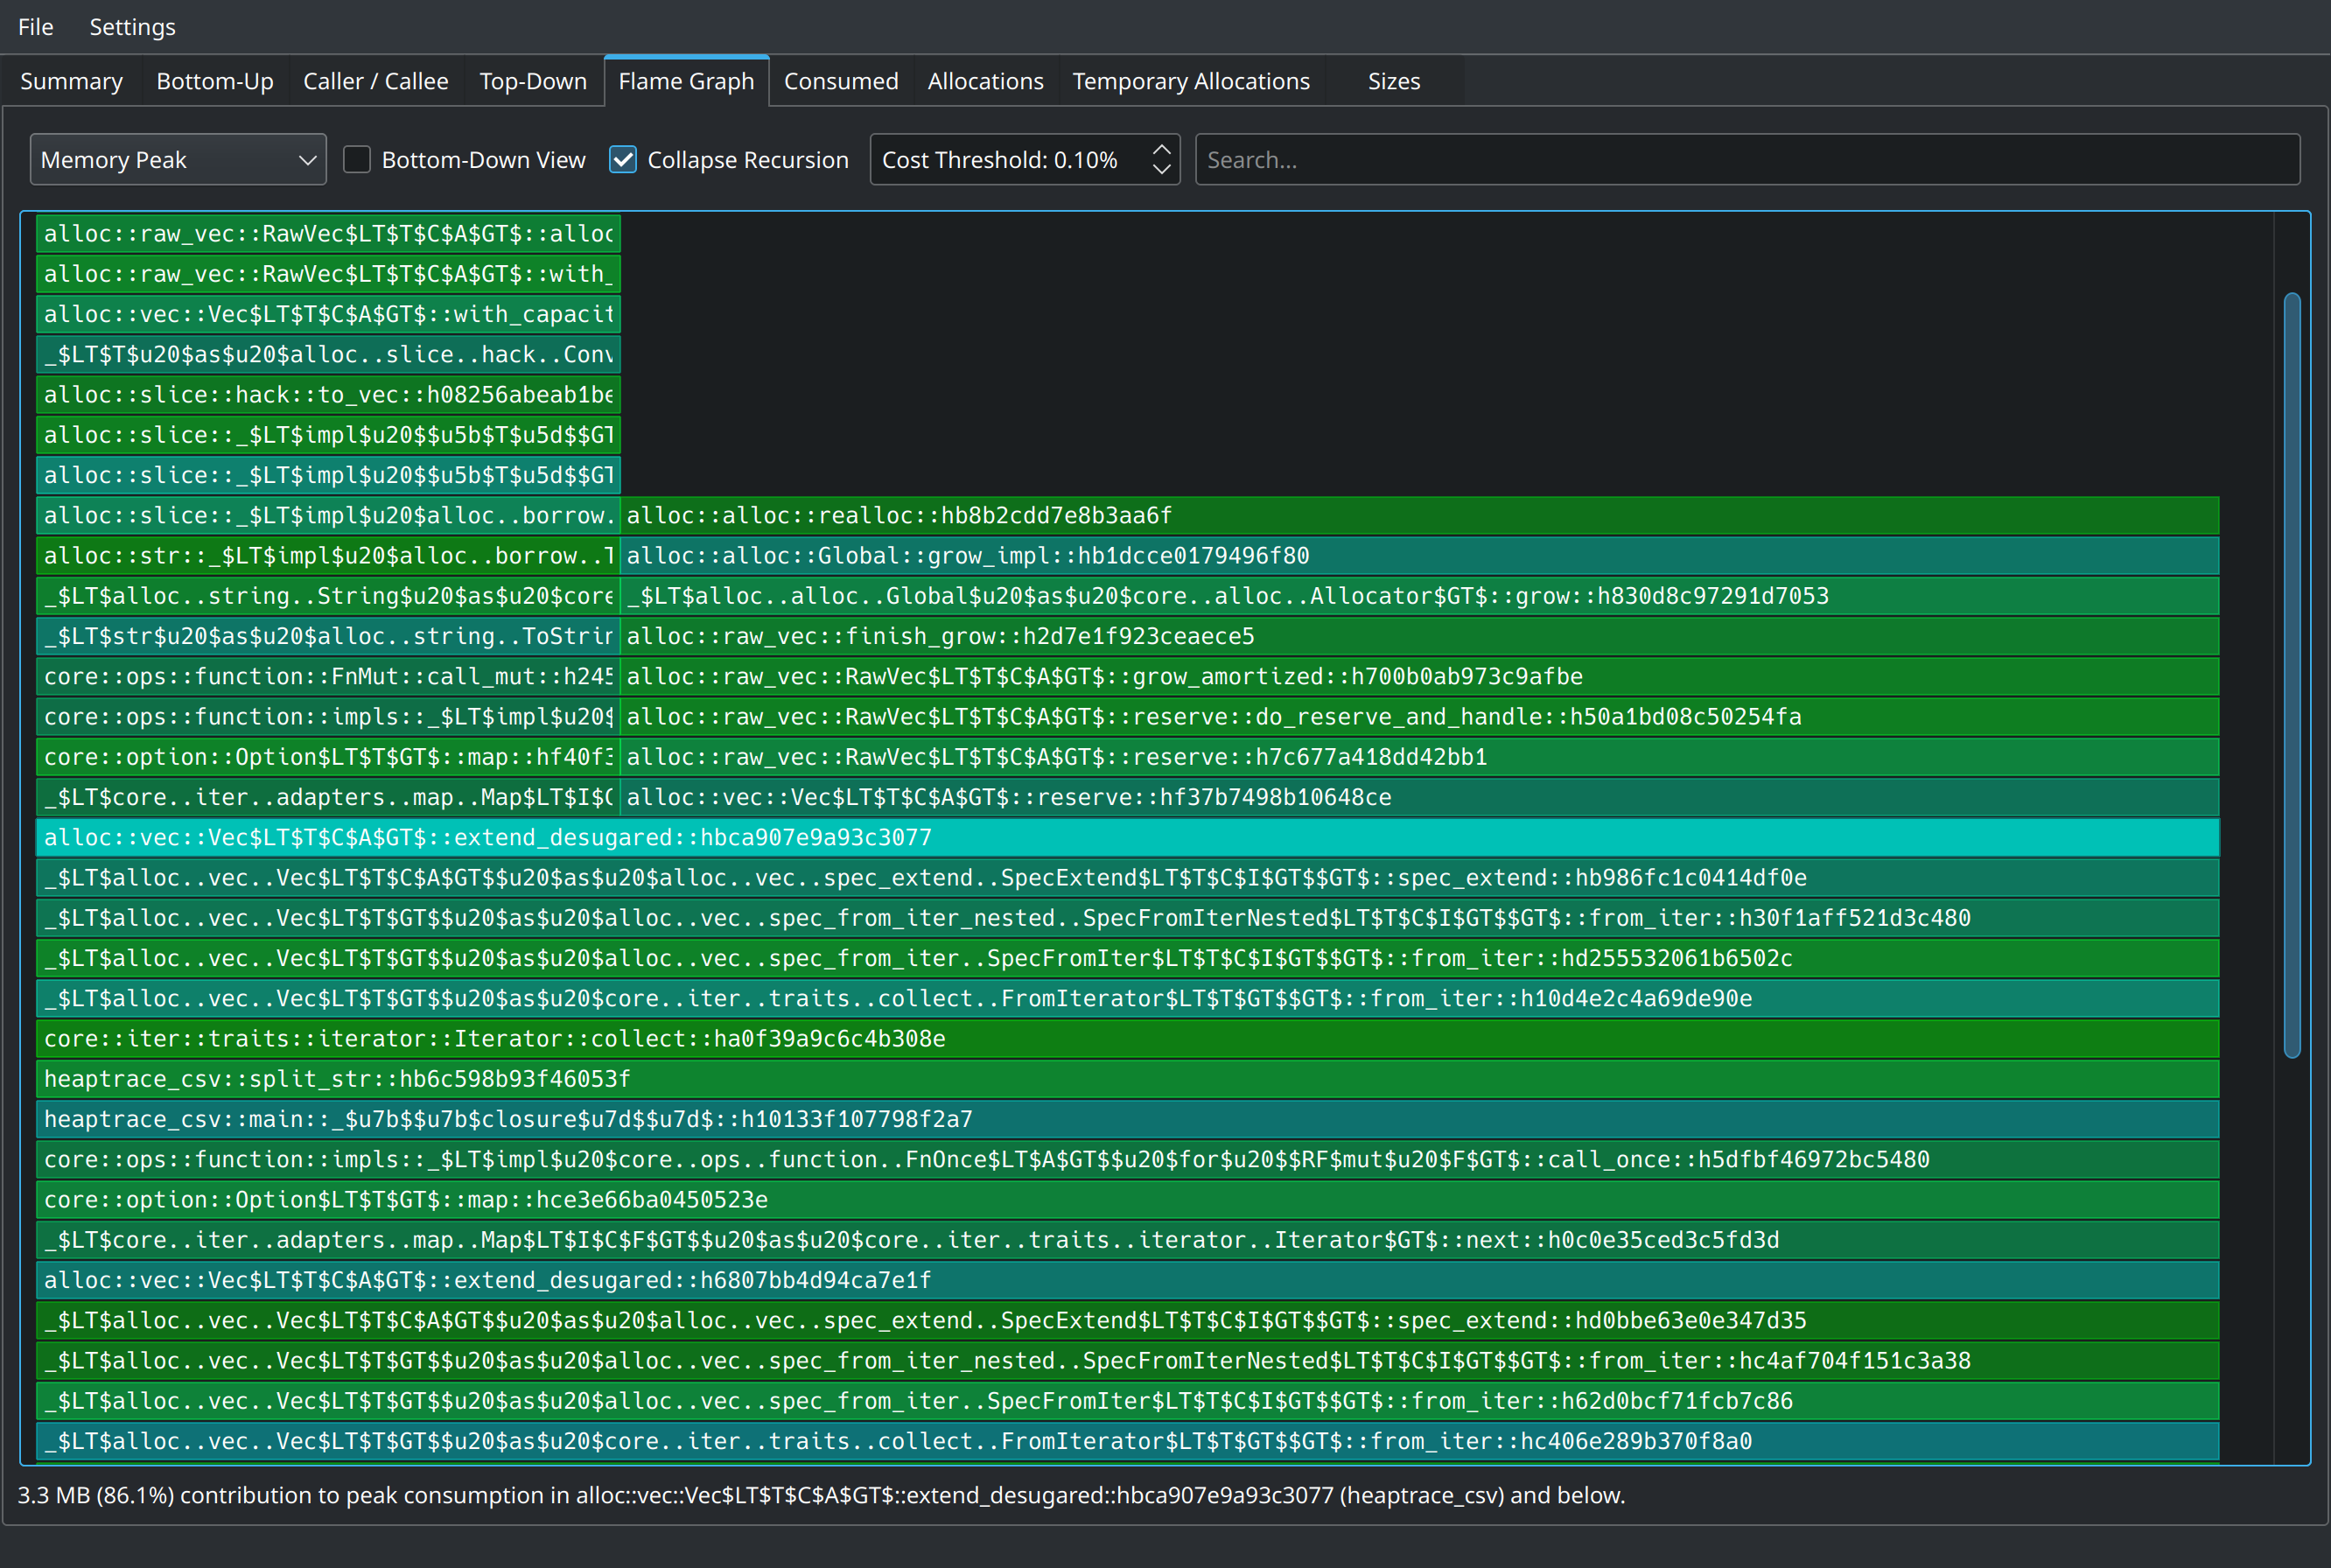
Additional resources Link to heading
- SO: measuring actual memory usage
- Profiling book
- Rust analyzer measuring memory usage
- Reading files rust way
- Fasterthanlime: small strings