I’m going through the fantastic book “Systems Performance” by Brendan Gregg. And I find it very useful to test the tools themselves and see how they work.
So, I decided to write articles about the tools and techniques Brendan Gregg describes in his book. I will prepare a sample rust program to generate specific load on the system, and we will use the tools to analyze the system’s performance. We will focus on the tools available on Linux systems to examine each domain.
To follow the series visit the site: observability
Contents:
CPU Usage Link to heading
Cpu bound load generator Link to heading
We can use the stress tool to generate some load on the system or to get more control over the load, we can use a custom small rust program.
It will count the CPU cores available and spawn four threads per core.
Each thread will calculate the sum of squares of numbers from 1 to 1000 in an infinite loop.
use std::thread;

fn main() {
    // Get the number of CPU cores available
    let num_cpus = num_cpus::get();
    let num_threads = num_cpus * 4;

    let mut handles = vec![];

    // Spawn the threads
    for _ in 0..num_threads {
        let handle = thread::spawn(move || {
            loop {
                // Perform some meaningful calculation
                let _sum_of_squares: u64 = sum_of_square(1000);
                // loop until Ctrl-C is pressed

            }
        });
        handles.push(handle);
    }

    // block until all threads have finished
    for handle in handles {
        handle.join().unwrap();
    }
}

fn sum_of_square(n: u64) -> u64 {
    (1..=n).map(|x| x * x).sum()
}
Uptime
Link to heading
The uptime command shows how long the system has been running, the number of users, and the load average for the past 1, 5, and 15 minutes.
❯ uptime
 14:56:53  up   2:23,  1 user,  load average: 71.16, 16.19, 5.76
From the man page we can see
System load averages is the average number of processes that are
   either in a runnable or uninterruptable state.  A process in a
   runnable state is either using the CPU or waiting to use the CPU.
   A process in uninterruptable state is waiting for some I/O
   access, eg waiting for disk.  The averages are taken over the
   three time intervals.  Load averages are not normalized for the
   number of CPUs in a system, so a load average of 1 means a single
   CPU system is loaded all the time while on a 4 CPU system it
   means it was idle 75% of the time.
From the above output, we can see that the system has been running for 2 hours and received a lot of load in the past 1 minute (I launched the load generator). My machine is a 16-core machine, so the load average of 71 might suggest that the system is overloaded, and we should investigate the saturation of the CPU. We can see that by looking into stall information:
❯ cat /proc/pressure/cpu
some avg10=84.57 avg60=76.89 avg300=39.52 total=338408435
full avg10=0.00 avg60=0.00 avg300=0.00 total=0
The pressure directory contains information about the CPU pressure. The avg10, avg60, and avg300 are the average number of tasks waiting for CPU in the past 10, 60, and 300 seconds.
The some line suggests that the threads are waiting for CPU time, and the entire line suggests that the threads are not waiting for CPU time.
The avg10 value of 84.57 indicates that the system is stalled for 84.57% of the time in the past 10 seconds.
Vmstat
Link to heading
The vmstat command reports information about processes, memory, paging, block IO, traps, and CPU activity.
The first row of the output shows the average values since the system was started. The following rows show the values for each period.
~
❯ vmstat -w 1
--procs-- -----------------------memory---------------------- ---swap-- -----io---- -system-- --------cpu--------
   r    b         swpd         free         buff        cache   si   so    bi    bo   in   cs  us  sy  id  wa  st
   0    0            0     31799332        10084      3593984    0    0    21    98   99   52   6   0  93   0   0
   0    0            0     31744052        10088      3593824    0    0     0    32 5901 6982   1   0  99   0   0
   0    0            0     31762132        10088      3593920    0    0     0  9632 6322 8837   0   0 100   0   0
   0    0            0     31755140        10088      3593920    0    0     0    16 5875 6788   0   0  99   0   0
 130    0            0     31758472        10104      3593856    0    0     8   736 26434 31901  21   1  78   0   0
 128    0            0     31755500        10104      3594376    0    0     0     0 62882 18366 100   0   0   0   0
 128    0            0     31754252        10104      3593892    0    0     0     0 60136 13456 100   0   0   0   0

Vm stat column meaning
We can see again that when I run the stress generator, the r column increases, which means that the number of processes waiting for CPU time increases.
The us column rises, which means the CPU is busy, and the id column decreases, which means the CPU is idle for less time.
mpstat
Link to heading
mpstat reports processor-related statistics. It allows us to notice the uneven load distribution across the cores.
❯ mpstat -P ALL 1
Linux 6.6.33 (amd-pc)   06/19/24        _x86_64_        (32 CPU)

15:28:31     CPU    %usr   %nice    %sys %iowait    %irq   %soft  %steal  %guest   %idle
15:28:32     all   99.62    0.00    0.16    0.00    0.22    0.00    0.00    0.00    0.00
15:28:32       0   99.01    0.00    0.00    0.00    0.00    0.99    0.00    0.00    0.00
15:28:32       1  100.00    0.00    0.00    0.00    0.00    0.00    0.00    0.00    0.00
15:28:32       2  100.00    0.00    0.00    0.00    0.00    0.00    0.00    0.00    0.00
15:28:32       3  100.00    0.00    0.00    0.00    0.00    0.00    0.00    0.00    0.00
15:28:32       4  100.00    0.00    0.00    0.00    0.00    0.00    0.00    0.00    0.00
15:28:32       5  100.00    0.00    0.00    0.00    0.00    0.00    0.00    0.00    0.00
15:28:32       6  100.00    0.00    0.00    0.00    0.00    0.00    0.00    0.00    0.00
15:28:32       7   99.01    0.00    0.00    0.00    0.99    0.00    0.00    0.00    0.00
15:28:32       8  100.00    0.00    0.00    0.00    0.00    0.00    0.00    0.00    0.00
15:28:32       9   99.01    0.00    0.00    0.00    0.99    0.00    0.00    0.00    0.00
15:28:32      10   99.01    0.00    0.00    0.00    0.99    0.00    0.00    0.00    0.00
15:28:32      11   99.00    0.00    0.00    0.00    1.00    0.00    0.00    0.00    0.00
15:28:32      12   98.00    0.00    2.00    0.00    0.00    0.00    0.00    0.00    0.00
15:28:32      13  100.00    0.00    0.00    0.00    0.00    0.00    0.00    0.00    0.00
15:28:32      14   99.01    0.00    0.00    0.00    0.00    0.99    0.00    0.00    0.00
15:28:32      15   99.01    0.00    0.00    0.00    0.99    0.00    0.00    0.00    0.00
15:28:32      16   99.01    0.00    0.00    0.00    0.99    0.00    0.00    0.00    0.00
15:28:32      17  100.00    0.00    0.00    0.00    0.00    0.00    0.00    0.00    0.00
15:28:32      18   96.04    0.00    2.97    0.00    0.99    0.00    0.00    0.00    0.00
15:28:32      19  100.00    0.00    0.00    0.00    0.00    0.00    0.00    0.00    0.00
15:28:32      20  100.00    0.00    0.00    0.00    0.00    0.00    0.00    0.00    0.00
15:28:32      21  100.00    0.00    0.00    0.00    0.00    0.00    0.00    0.00    0.00
15:28:32      22  100.00    0.00    0.00    0.00    0.00    0.00    0.00    0.00    0.00
15:28:32      23  100.00    0.00    0.00    0.00    0.00    0.00    0.00    0.00    0.00
15:28:32      24  100.00    0.00    0.00    0.00    0.00    0.00    0.00    0.00    0.00
15:28:32      25  100.00    0.00    0.00    0.00    0.00    0.00    0.00    0.00    0.00
15:28:32      26  100.00    0.00    0.00    0.00    0.00    0.00    0.00    0.00    0.00
15:28:32      27  100.00    0.00    0.00    0.00    0.00    0.00    0.00    0.00    0.00
15:28:32      28  100.00    0.00    0.00    0.00    0.00    0.00    0.00    0.00    0.00
15:28:32      29  100.00    0.00    0.00    0.00    0.00    0.00    0.00    0.00    0.00
15:28:32      30  100.00    0.00    0.00    0.00    0.00    0.00    0.00    0.00    0.00
15:28:32      31  100.00    0.00    0.00    0.00    0.00    0.00    0.00    0.00    0.00
^C
turbostat
Link to heading
turbostat reports processor related statistics based on MSR registers. It can be used to see the frequency of the CPU cores and the power consumption.
Core  CPU     Avg_MHz Busy%   Bzy_MHz TSC_MHz IPC     IRQ     POLL    C1      C2      C3      POLL%   C1%     C2%     C3%     CorWatt │
PkgWatt                                                                                                                                 │
-       -       5195    100.00  5195    4471    0.50    105131  0       0       0       0       0.00    0.00    0.00    0.00    153.49  │
157.42                                                                                                                                  │
0       0       5252    100.00  5252    4491    0.50    3247    0       0       0       0       0.00    0.00    0.00    0.00    9.71    │
158.37                                                                                                                                  │
0       16      5252    100.00  5252    4491    0.50    3230    0       0       0       0       0.00    0.00    0.00    0.00            │
1       1       5252    100.00  5252    4491    0.50    3199    0       0       0       0       0.00    0.00    0.00    0.00    9.96    │
1       17      5252    100.00  5252    4491    0.50    3456    0       0       0       0       0.00    0.00    0.00    0.00            │
2       2       5252    100.00  5252    4491    0.50    3215    0       0       0       0       0.00    0.00    0.00    0.00    9.83    │
2       18      5252    100.00  5252    4491    0.50    3217    0       0       0       0       0.00    0.00    0.00    0.00            │
3       3       5252    100.00  5252    4491    0.50    3191    0       0       0       0       0.00    0.00    0.00    0.00    10.13   │
3       19      5252    100.00  5252    4491    0.50    3218    0       0       0       0       0.00    0.00    0.00    0.00            │
4       4       5252    100.00  5252    4491    0.50    3212    0       0       0       0       0.00    0.00    0.00    0.00    9.89    │
4       20      5252    100.00  5252    4491    0.51    3208    0       0       0       0       0.00    0.00    0.00    0.00            │
5       5       5252    100.00  5252    4491    0.50    3185    0       0       0       0       0.00    0.00    0.00    0.00    10.15   │
5       21      5252    100.00  5252    4491    0.50    3194    0       0       0       0       0.00    0.00    0.00    0.00            │
6       6       5252    100.00  5252    4491    0.50    3164    0       0       0       0       0.00    0.00    0.00    0.00    9.76    │
6       22      5252    100.00  5252    4491    0.50    3241    0       0       0       0       0.00    0.00    0.00    0.00            │
7       7       5252    100.00  5252    4491    0.50    3179    0       0       0       0       0.00    0.00    0.00    0.00    9.94    │
7       23      5252    100.00  5252    4491    0.50    3449    0       0       0       0       0.00    0.00    0.00    0.00            │
8       8       5186    100.00  5186    4491    0.50    3231    0       0       0       0       0.00    0.00    0.00    0.00    9.37    │
8       24      5186    100.00  5186    4491    0.50    3186    0       0       0       0       0.00    0.00    0.00    0.00            │
9       9       5186    100.00  5186    4491    0.50    3433    0       0       0       0       0.00    0.00    0.00    0.00    9.20    │
9       25      5186    99.99   5186    4491    0.50    3432    0       0       0       0       0.00    0.00    0.00    0.00            │
10      10      5186    100.00  5186    4491    0.50    3268    0       0       0       0       0.00    0.00    0.00    0.00    9.48    │
10      26      5186    100.00  5186    4491    0.50    3166    0       0       0       0       0.00    0.00    0.00    0.00            │
11      11      5186    100.00  5186    4491    0.51    3158    0       0       0       0       0.00    0.00    0.00    0.00    9.32    │
11      27      5186    100.00  5186    4491    0.50    3376    0       0       0       0       0.00    0.00    0.00    0.00            │
12      12      5186    100.00  5186    4491    0.50    3178    0       0       0       0       0.00    0.00    0.00    0.00    9.49    │
12      28      5186    100.00  5186    4491    0.51    3436    0       0       0       0       0.00    0.00    0.00    0.00            │
13      13      5186    100.00  5186    4491    0.50    3194    0       0       0       0       0.00    0.00    0.00    0.00    9.33    │
13      29      5186    100.00  5186    4491    0.50    3169    0       0       0       0       0.00    0.00    0.00    0.00            │
14      14      5186    100.00  5186    4491    0.50    3218    0       0       0       0       0.00    0.00    0.00    0.00    9.41    │
14      30      5186    100.00  5186    4491    0.51    4181    0       0       0       0       0.00    0.00    0.00    0.00            │
15      15      5186    100.00  5186    4491    0.51    3453    0       0       0       0       0.00    0.00    0.00    0.00    9.27    │
15      31      5186    100.00  5186    4491    0.50    3247    0       0       0       0       0.00    0.00    0.00    0.00            │
perf
Link to heading
perf is an invaluable tool for performance analysis. We can use it to profile the system and see the hotspots in the code.
# record the CPU usage of the program by sampling the stack traces at 99 Hertz
perf record -F 99 --call-graph=dwarf /home/flakm/.cargo/target/release/cpu_usage

# fold stack traces. This can also be done with the original stackcollapse-perf.pl
perf script | inferno-collapse-perf > stacks.folded

# save the flamegraph to svg. This can also be done with the original flamegraph.pl
cat stacks.folded | inferno-flamegraph > flamegraph.svg

Flamegraph (interactive)
Perf has amazing utility to show the top like page for both user and kernel space by using perf top command.
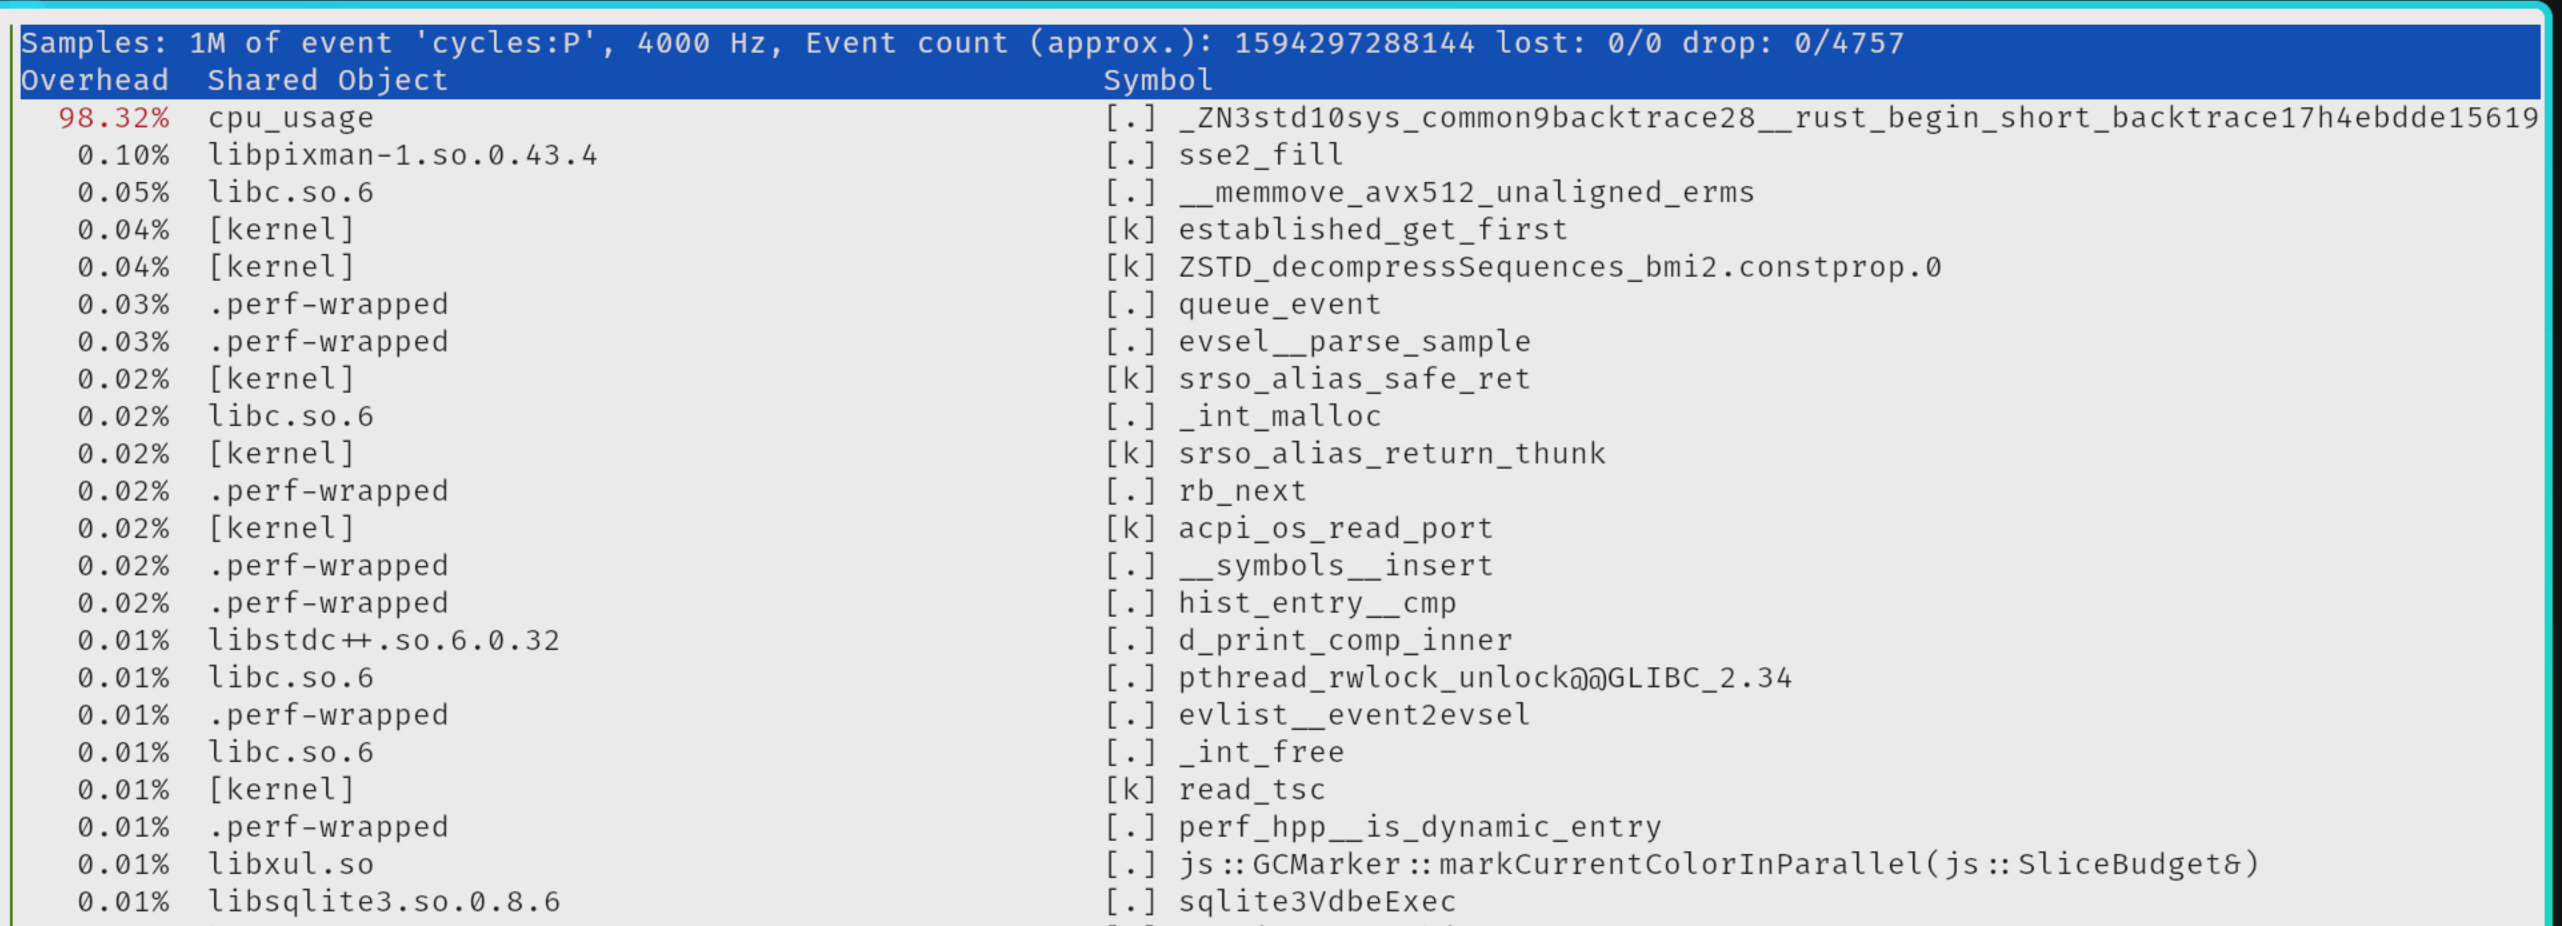
Perf top showing top like page for both user and kernel space
The symbol can be demangled by using rustfilt tool.
❯ rustfilt _ZN3std10sys_common9backtrace28__rust_begin_short_backtrace17h4ebdde1561976a47E.llvm.12070465765005206877
std::sys_common::backtrace::__rust_begin_short_backtrace
eBPF based traces Link to heading
Similar to perf, we can use eBPF based tools to trace the system. Which is even more powerful since folding is performed in the kernel space.
sudo profile -F 99 -adf 10 > out.profile-folded
flamegraph.pl out.profile-folded > profile.svg

Flamegraph from profile (interactive)
Checking saturiation Link to heading
Expect for the above tools we can also use the runqlat and runqlen tools to check the saturation of the CPU.
runqlat
Link to heading
Running runqlat will show the latency of the scheduler run queue. It will show how long the threads are waiting for CPU time.
Here is the output of the command when the load generator is not running:
❯ sudo runqlat
Tracing run queue latency... Hit Ctrl-C to end.
^C
     usecs               : count     distribution
         0 -> 1          : 39370    |****************************************|
         2 -> 3          : 8571     |********                                |
         4 -> 7          : 7261     |*******                                 |
         8 -> 15         : 352      |                                        |
        16 -> 31         : 287      |                                        |
        32 -> 63         : 301      |                                        |
        64 -> 127        : 56       |                                        |
       128 -> 255        : 26       |                                        |
       256 -> 511        : 3        |                                        |
       512 -> 1023       : 57       |                                        |
      1024 -> 2047       : 1        |                                        |
      2048 -> 4095       : 2        |                                        |
And here is the output when the load generator is running:
❯ sudo runqlat
Tracing run queue latency... Hit Ctrl-C to end.
^C
     usecs               : count     distribution
         0 -> 1          : 36231    |****************************************|
         2 -> 3          : 12469    |*************                           |
         4 -> 7          : 11977    |*************                           |
         8 -> 15         : 5789     |******                                  |
        16 -> 31         : 3455     |***                                     |
        32 -> 63         : 2989     |***                                     |
        64 -> 127        : 1082     |*                                       |
       128 -> 255        : 883      |                                        |
       256 -> 511        : 460      |                                        |
       512 -> 1023       : 705      |                                        |
      1024 -> 2047       : 1709     |*                                       |
      2048 -> 4095       : 7619     |********                                |
      4096 -> 8191       : 7950     |********                                |
      8192 -> 16383      : 19868    |*********************                   |
     16384 -> 32767      : 16858    |******************                      |
     32768 -> 65535      : 1188     |*                                       |
     65536 -> 131071     : 4        |                                        |
We can see that the latency of the run queue is much higher when the load generator is running. It shows that the threads are waiting for CPU time since we are scheduling more work than the CPU can handle.
runqlen
Link to heading
We can also observe the length of the scheduler run queue by using the runqlen tool.
❯ sudo runqlen
Sampling run queue length... Hit Ctrl-C to end.
^C
     runqlen       : count     distribution
        0          : 29642    |****************************************|
And with the load generator running:
❯ sudo runqlen
Sampling run queue length... Hit Ctrl-C to end.
^C
     runqlen       : count     distribution
        0          : 4379     |***************************             |
        1          : 1601     |*********                               |
        2          : 2977     |******************                      |
        3          : 6004     |*************************************   |
        4          : 6454     |****************************************|
        5          : 3016     |******************                      |
        6          : 837      |*****                                   |
        7          : 566      |***                                     |
        8          : 159      |                                        |
        9          : 93       |                                        |
        10         : 22       |                                        |
        11         : 11       |                                        |
        12         : 3        |                                        |
        13         : 0        |                                        |
        14         : 7        |                                        |
        15         : 15       |                                        |
Conclusion Link to heading
We have seen how to analyze the CPU usage of the system using various tools like uptime, vmstat, mpstat, turbostat, perf, eBPF based tools, runqlat, runqlen.
Those tools are invaluable to understand the system’s performance and to find the bottlenecks in the system.